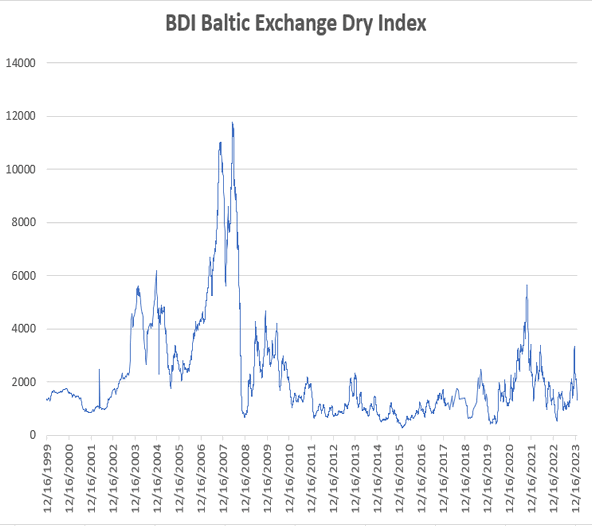
Baltic Dry Index Collapses 50% From December Highs To 5-Month Lows

- Baltic Dry BDI compared with Tn
We are sure it's just a storm in a teacup; just a brief interlude before the IMF's ever-changing forecast for global trade growth picks right back up again and demand to ship dry goods surges back to the inventory stuffed levels of Q4. But, for now, the Baltic Dry Index (admired when it's rising, ignored when it drops) has collapsed by over 50% from its December highs and is back to August lows.

Charts: Bloomberg
Some more charts......
Baltic Exchange Dry Index (BDI)
& 10 Year Notes (Log Chart)(red)
| |
 |
Baltic Exchange Dry Index (BDI)
& Gold (gold)
"Logarithmic Graph"
| |
 |
Baltic Exchange Dry Index (BDI),
exponential average in red.
200 day exp. avr. green
| ||
 |
No comments:
Post a Comment