http://www.zerohedge.com/news/2013-04-17/us-mint-sells-record-63500-ounces-gold-one-day
 Submitted by Tyler Durden on 04/17/2013 21:23 -0400

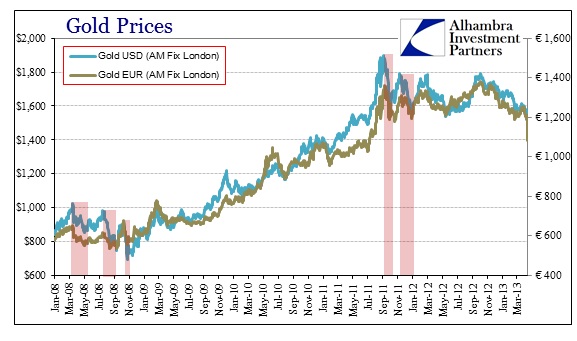
and a connection between falling gold price and extreme stress in the banking systems - does a major gold sell off preview declines in systemic liquidity ? ?
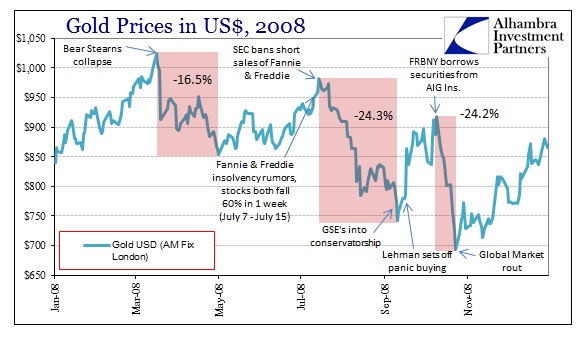
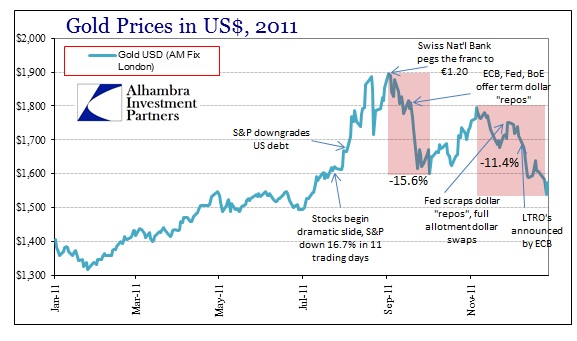
http://www.alhambrapartners.com/2013/04/15/we-have-seen-gold-prices-act-like-this-before/
http://harveyorgan.blogspot.com/2013/04/silver-oi-still-very-high-at-157302.html
* * *
selected PM news items.....
*CFTC Is Looking at Gold, Silver Moves, Chilton Says
http://www.bloomberg.com/video/cftc-is-looking-at-gold-sil
ver-moves-chilton-says-rOV~19vGRN2g7HM2UJTgAQ.html
and Bill Murphy's response to Bart Chilton: (CFTC commissioner)
Hello Bart,
You have to be kidding me!
Somebody sells 53,000 contracts on Sunday night in a lightly traded market, to collapse the price, and you think this is some speculator? Good grief.
What just happened these past few days is just what I have been explaining to you for four years
and I gone nowhere with it.
One disgusted Bill Murphy
Take care
Bill
http://www.zerohedge.com/news/2013-04-17/gold-buying-frenzy-continues-china-japan-and-australia-scramble-physical
Submitted by Tyler Durden on 04/17/2013 08:47 -0400
http://silverdoctors.com/odds-of-comex-default-increasing-exponentially/#more-25188

and.....
http://www.caseyresearch.com/gsd/edition/ted-butler-the-price-smash-who-what-how-and-why/


US Mint Sells Record 63,500 Ounces Of Gold In One Day
One of the more curious revelations of the New Normal is the fundamental dichotomy when investing between paper "investors", or those who chase returns based on intangible, fiat-based and central bank-backed promises, such as capital appreciation or cash flow streams, and those who would rather convert their paper money into hard assets, even if said assets can not be, in the immortal words of Warren Buffett, fondled, or otherwise generate a cash-based return. Such as gold.
Today provides perhaps the perfect example of how the former increasingly trade on nothing but momentum and speculative mania (such as the previously reported record inflow of foreign capital into the Japanese stock market well after the bulk of the easy upside has already been made and at this point there is mostly downside) and where buying begets only more buying, while rampant selling only leads to liquidations, while those who invest in hard assets (and thus have little to no leverage) have become the true value investors, purchasing more as the price of the underlying asset drops. Yes, a novel concept to most High Frequency Trading vacuum tubes, and the momentum-chasing, equity trading "expert" du jour, but nothing new to Indians, Australians, Chinese or the Japanese.
And apparently to at least some Americans.
According to today's data from the US Mint, a record 63,500 ounces, or a whopping 2 tons, of gold were reported sold on April 17th alone, bringing the total sales for the month to a whopping 147,000 ounces or more than the previous two months combined with just half of the month gone.
Punchline number one, as the chart below shows, is that the more the price of gold fell, the more aggressive the purchases of physical gold through the Mint became, rising to 96,500 oz in the last two days alone. Buying more of something you want when the price drops: what a stunning concept - explain that to the algos who nearly crashed the German stock market overnight.
Punchline number two, of course, is that the US mint charges a hefty premium for purchases: much more so than traditional vendors like Apmex or Gainesville Coins, and is usually the last resort for when nobody else has any physical at a lower premium to spot (or any metal in inventory).

So how long until the US mint "runs out" of American Eagles and Buffaloes in inventory, along with the depletion of all other precious metal vendors? And what happens if the price of paper gold hits zero (or goes negative) courtesy of bank and financial institution liquidation selling of paper derivative contracts nebulously referencing some yellow metal somewhere, even as suddenly there is no physical to be delivered to anyone, anywhere?
Inquiring minds really want to know.
h/t Alex, source US Mint
and a connection between falling gold price and extreme stress in the banking systems - does a major gold sell off preview declines in systemic liquidity ? ?
http://www.alhambrapartners.com/2013/04/15/we-have-seen-gold-prices-act-like-this-before/
http://harveyorgan.blogspot.com/2013/04/silver-oi-still-very-high-at-157302.html
Wednesday, April 17, 2013
silver OI still very high at 157,302/ amount of gold standing: 34.45 tonnes/silver at 3.715 million oz/Egan Jones lowers rating on Germany/
Good evening Ladies and Gentlemen:
Gold closed down $3.00 to $1382.20 (comex closing time). Silver fell by 32 cents to $23.30 (comex closing time).
In the access market at 5 pm:
gold: $1375.00
silver: $23.30
The bankers started to massively short gold and silver equity shares and thus they will be ready to again attack our precious metals tomorrow. This is vintage gold cartel as they telegraph their moves to fellow criminal banking organizations.
At the comex, the open interest in silver fell considerably to 157,302 contracts . The open interest on the gold contract surprisingly fell by a huge 13,639 contracts to 413,083. Generally, I would say that 390,000 OI would be rock bottom for gold but in this environment anything goes. The total amount of gold ounces standing for April fell slightly to 34.45 tonnes but silver had an increase to 3.715 million oz standing.
Based on the massive price drop in silver, you must admit that many of the longs in silver are quite impervious to pain as they have suffered huge losses by holding onto their contracts. I strongly believe that many of these longs are sovereign China held through conduits.
Today we have a superb audio of Kingworld news Eric King discussing the
paper nonsense with John Embry.
We have a great commentary also on physical silver from Dr Craig Roberts.
Mark Grant gives another great commentary on the implosion of Europe that you must read. I believe it is your most important commentary of the day.
Egan Jones downgrades Germany from A plus to only A with a negative bias.
We will go over these and other stories but first.........................
Let us now head over to the comex and assess trading over there today:
The total gold comex open interest fell by a huge 13639 contracts today from 426,722 down to 413,083, with gold falling by $21.60. yesterday. The front April OI fell by 74 contracts from 742 down to 668. We had 9 notices filed on Tuesday so we lost 65 contracts or 6500 additional gold oz will be standing for the April gold contract month. The next non active contract month is May and here the OI rose by 40 contracts to 1381. The next big contract month is June and here the OI fell by a whopping 14,206 contracts from 270,390 down to 256,184. The estimated volume today was huge at 238,185 or 23.815 million oz. The world produces around 70 million oz ex China ex Russia. Thus today's volume equates to around 34% of global annual production. The confirmed volume on Tuesday was also huge at 454,957 (approx 1415 tonnes of gold).
The total silver comex OI finally fell by a very large 5113 contracts from 162,415 down to 157,302. . We looks like we still have some stoic longs who seem impervious to pain. The front non active delivery month of April saw its OI fall by 42 contracts from 105 down to 63 . We had 78 delivery notices filed on Tuesday, so in essence we gained 36 contracts or an additional 1800,000 oz of silver will stand for delivery in April. The next big delivery month for silver is May and here the OI fell by 6097 contracts to stand at 53,763. We are 2 weeks away from first day notice for the May silver delivery month. The estimated volume today was huge coming in at 99,768 contracts which equates close to 500 million oz of silver. The world produces 700 million oz per year ex China ex Russia so in essence today's volume equates to 71% of annual silver production. We had confirmed volume on Tuesday at 162,415 contracts which is a huge volume day . (.812 billion oz or 116% of annual silver production)
Comex gold/April contract month:
April 17.2013 April gold.
Ounces
Withdrawals from Dealers Inventory in oz
nil
Withdrawals from Customer Inventory in oz
98,296.722 (HSBC)
Deposits to the Dealer Inventory in oz
499.98 (Brinks)
Deposits to the Customer Inventory, in oz
nil
No of oz served (contracts) today
7 (700 oz)
No of oz to be served (notices)
661 (66,100) oz
Total monthly oz gold served (contracts) so far this month
10,415 (1,041,500 oz)
Total accumulative withdrawal of gold from the Dealers inventory this month
11,227.021
Total accumulative withdrawal of gold from the Customer inventory this month
184,394.12
We had good activity at the gold vaults.
The dealer had 1 deposits and 0 dealer withdrawals.
1) Dealer deposit:
Into Brinks: 499.98 oz
We had 0 customer deposits:
total customer deposit: nil oz
We had 1 customer withdrawals :
i) Out of HSBC: a huge 98,296.722 oz
total customer withdrawal: 98,296.722 oz
We had 1 adjustment:
Out of the JPMorgan vault: 8723.565 was adjusted out of the dealer and into the customer account.
Thus the dealer inventory rests tonight at 2.781 million oz (86.5) tonnes of gold.
The total of all gold at the comex rests at 9.016 million oz or 280.4 tonnes.
The comex is slowly losing its gold.
The CME reported that we had 7 notices filed for 700 oz of gold today. The total number of notices so far this month is thus 10,415 contracts x 100 oz per contract or 1,041,500 oz of gold. In order to establish what will be the total number of gold ounces standing, I take the OI for April (668) and subtract out Wednesday's delivery notices (7) which leaves us with 661 contracts or 66,100 oz left to be served upon our longs.
Thus we have the following gold ounces standing for metal:
1,041,500 (served) + 66,100 oz (left to be served upon ) = 1,107,600 oz or
34.45 tonnes of gold.
we lost 6500 oz of additional gold standing for the April gold contract. This is turning out to be a very big delivery month!1
Silver:
April 17.2013: April silver:
Silver
Ounces
Withdrawals from Dealers Inventory nil Withdrawals from Customer Inventory 484,213.90 oz (Brinks,CNT,HSBC,Scotia) Deposits to the Dealer Inventory nil Deposits to the Customer Inventory 630,567.4 (Scotia) No of oz served (contracts) 34 contracts (170,000 oz) No of oz to be served (notices) 29 (145,000 oz) Total monthly oz silver served (contracts) 714 (3,570,000 oz) Total accumulative withdrawal of silver from the Dealers inventory this month 1,272,381.0 oz Total accumulative withdrawal of silver from the Customer inventory this month 4,308,186.4
Today, we had good activity inside the silver vaults.
we had 0 dealer deposits and 0 dealer withdrawals.
We had 1 customer deposit:
i) Into Scotia: 630,567.4 oz
Total deposits: 630,567.4 oz
We had 3 customer withdrawals:
i) Out of Brinks: 401,197.77 oz
ii) Out of CNT: 20,451.86 oz
iii) Out of HSBC: 2000.17 oz
iv) Out of Scotia: 60,554.1
total customer withdrawal: 484,213.90 oz
we had 1 adjustments:
Out of the Delaware vault: 26,181.465 oz gets adjusted out of the customer account and enters the dealer account.
Registered silver at : 41.934 million oz
total of all silver: 165.432 million oz.
The CME reported that we had 34 notices filed for 170,000 oz of silver for the non active contract month of April. In order to calculate the number of silver ounces that will stand, I take the OI for April silver (63) and subtract out Wednesday's notices (34) which leaves us with 29 notices or 145,000 oz left to be served upon our longs.
Thus the total number of silver ounces standing in this non active delivery month of April is as follows:
3,5700,000 oz served + 145,000 oz to be served = 3,715,000 oz
Ounces
| |
Withdrawals from Dealers Inventory in oz
|
nil
|
Withdrawals from Customer Inventory in oz
|
98,296.722 (HSBC)
|
Deposits to the Dealer Inventory in oz
|
499.98 (Brinks)
|
Deposits to the Customer Inventory, in oz
| nil |
No of oz served (contracts) today
|
7 (700 oz)
|
No of oz to be served (notices)
|
661 (66,100) oz
|
Total monthly oz gold served (contracts) so far this month
|
10,415 (1,041,500 oz)
|
Total accumulative withdrawal of gold from the Dealers inventory this month
|
11,227.021
|
Total accumulative withdrawal of gold from the Customer inventory this month
| 184,394.12 |
We had good activity at the gold vaults.
The dealer had 1 deposits and 0 dealer withdrawals.
1) Dealer deposit:
Into Brinks: 499.98 oz
Into Brinks: 499.98 oz
We had 0 customer deposits:
total customer deposit: nil oz
We had 1 customer withdrawals :
i) Out of HSBC: a huge 98,296.722 oz
total customer withdrawal: 98,296.722 oz
total customer deposit: nil oz
We had 1 customer withdrawals :
i) Out of HSBC: a huge 98,296.722 oz
total customer withdrawal: 98,296.722 oz
We had 1 adjustment:
Out of the JPMorgan vault: 8723.565 was adjusted out of the dealer and into the customer account.
Out of the JPMorgan vault: 8723.565 was adjusted out of the dealer and into the customer account.
Thus the dealer inventory rests tonight at 2.781 million oz (86.5) tonnes of gold.
The total of all gold at the comex rests at 9.016 million oz or 280.4 tonnes.
The comex is slowly losing its gold.
The total of all gold at the comex rests at 9.016 million oz or 280.4 tonnes.
The comex is slowly losing its gold.
The CME reported that we had 7 notices filed for 700 oz of gold today. The total number of notices so far this month is thus 10,415 contracts x 100 oz per contract or 1,041,500 oz of gold. In order to establish what will be the total number of gold ounces standing, I take the OI for April (668) and subtract out Wednesday's delivery notices (7) which leaves us with 661 contracts or 66,100 oz left to be served upon our longs.
Thus we have the following gold ounces standing for metal:
1,041,500 (served) + 66,100 oz (left to be served upon ) = 1,107,600 oz or
34.45 tonnes of gold.
we lost 6500 oz of additional gold standing for the April gold contract. This is turning out to be a very big delivery month!1
Thus we have the following gold ounces standing for metal:
1,041,500 (served) + 66,100 oz (left to be served upon ) = 1,107,600 oz or
34.45 tonnes of gold.
we lost 6500 oz of additional gold standing for the April gold contract. This is turning out to be a very big delivery month!1
Silver:
April 17.2013: April silver:
| Silver |
Ounces
|
| Withdrawals from Dealers Inventory | nil |
| Withdrawals from Customer Inventory | 484,213.90 oz (Brinks,CNT,HSBC,Scotia) |
| Deposits to the Dealer Inventory | nil |
| Deposits to the Customer Inventory | 630,567.4 (Scotia) |
| No of oz served (contracts) | 34 contracts (170,000 oz) |
| No of oz to be served (notices) | 29 (145,000 oz) |
| Total monthly oz silver served (contracts) | 714 (3,570,000 oz) |
| Total accumulative withdrawal of silver from the Dealers inventory this month | 1,272,381.0 oz |
| Total accumulative withdrawal of silver from the Customer inventory this month | 4,308,186.4 |
Today, we had good activity inside the silver vaults.
we had 0 dealer deposits and 0 dealer withdrawals.
We had 1 customer deposit:
i) Into Scotia: 630,567.4 oz
Total deposits: 630,567.4 oz
We had 3 customer withdrawals:
i) Out of Brinks: 401,197.77 oz
ii) Out of CNT: 20,451.86 oz
iii) Out of HSBC: 2000.17 oz
iv) Out of Scotia: 60,554.1
total customer withdrawal: 484,213.90 oz
We had 1 customer deposit:
i) Into Scotia: 630,567.4 oz
Total deposits: 630,567.4 oz
We had 3 customer withdrawals:
i) Out of Brinks: 401,197.77 oz
ii) Out of CNT: 20,451.86 oz
iii) Out of HSBC: 2000.17 oz
iv) Out of Scotia: 60,554.1
total customer withdrawal: 484,213.90 oz
we had 1 adjustments:
Out of the Delaware vault: 26,181.465 oz gets adjusted out of the customer account and enters the dealer account.
Out of the Delaware vault: 26,181.465 oz gets adjusted out of the customer account and enters the dealer account.
Registered silver at : 41.934 million oz
total of all silver: 165.432 million oz.
The CME reported that we had 34 notices filed for 170,000 oz of silver for the non active contract month of April. In order to calculate the number of silver ounces that will stand, I take the OI for April silver (63) and subtract out Wednesday's notices (34) which leaves us with 29 notices or 145,000 oz left to be served upon our longs.
Thus the total number of silver ounces standing in this non active delivery month of April is as follows:
3,5700,000 oz served + 145,000 oz to be served = 3,715,000 oz
Thus the total number of silver ounces standing in this non active delivery month of April is as follows:
3,5700,000 oz served + 145,000 oz to be served = 3,715,000 oz
we gained 180,000 oz of additional silver standing.
This is also turning out to be a very good delivery schedule for what is usually a quiet month as April is a non active month for silver.
This is also turning out to be a very good delivery schedule for what is usually a quiet month as April is a non active month for silver.
* * *
Twenty more tons of gold gone since 4/15 from the GLD ETF .....gold physical going bye bye much faster than silver from the SLV ETF....
April 17.2013:
Tonnes1,134.79
Ounces36,484,650.02
Value US$50.770 billion.
* * *
selected PM news items.....
*CFTC Is Looking at Gold, Silver Moves, Chilton Says
http://www.bloomberg.com/video/cftc-is-looking-at-gold-sil
ver-moves-chilton-says-rOV~19vGRN2g7HM2UJTgAQ.html
and Bill Murphy's response to Bart Chilton: (CFTC commissioner)
Hello Bart,
You have to be kidding me!
Somebody sells 53,000 contracts on Sunday night in a lightly traded market, to collapse the price, and you think this is some speculator? Good grief.
What just happened these past few days is just what I have been explaining to you for four years
and I gone nowhere with it.
One disgusted Bill Murphy
Take care
Bill
Paul Craig Roberts: Attack on gold is just part of pervasive corruption
Submitted by cpowell on Wed, 2013-04-17 04:43. Section: Daily Dispatches
And I guess very few were around for the early days (2001 - 2004). I remember waking up in the morning and seeing gold down $10 and then watching in horror as the Comex operators took gold down another $10. $20 on a base of $400 is 5%. A 5% intra-day down-swing was not uncommon back then. But not many people watched the sector (CNBC didn't even have a gold price indicator on it's market scroll) so not many remember those days
No one said this sector was going to be easy. After all, gold is the "anti-Christ" of fiat currency-based Governmental and Central Bank systems. It's Dave vs. Goliath, people. The Old Testament tells me that David kicked Goliath's ass.
What just happened in the metals market was a by-product of a creatively planned and well-orchestrated take-down of gold/silver by the Federal Reserve, with the help of the bullion banks (JPM, Goldman, etc) and the unwitting help of the big, computer-driven macro hedge funds. I don't want to go into a play-by-play accounting of the details - it will put you to sleep or many of you would be in disbelief. But I know how manipulation works. I used to help manipulate the junk bond market in the 1990's. I remember the trade that put me on the map at my firm was $10 million face trade of bonds that the RTC had acquired in the S&L liquidation and into a firm owned by the very wealthy owner of one of the NFL football teams. We manipulated that trade in order to create a 50% mark-up from the price we paid the Government to the price we got paid by the smart investor. We had to hold the position overnight to get around the old NASD 5% mark-up rule and convinced the compliance people to look the other way. Back then a $3 million profit on a junk bond trade might compose 30% of the desk P&L for the year. We did that in one trade. Ya the market isn't manipulated...today the numbers involved and degree of illegality is many multiples of what they were 20 years ago. Today we wouldn't have had to hide the trade from compliance until after the cash register was rung.
I have a bone to pick with an article posted on Yahoo yesterday in which some shit-for-brains market "expert" from Societe Generale claims that the "era" of gold is over. You can read his mindless drool here: LINK Here's the commentary that made me roll my eyes:
What are the factors Haigh is examining? Is it the recent plunge in retail sales? How about the fact that for the month of January the number of households using foodstamps hit a new record (23 million, which means roughly 20% of all households) LINK. How about the plunge in railcar loadings (I bet most of you weren't aware of that grass-roots economic indicator) LINK How about the fact that over 100 million people in this country are either unemployed or haven't been able to find work for so long that the Government has decided they're not part of the "labor force?" Are those the indicators that Haigh is using in his analysis?
How about the fact the sovereign domicile of Michael's French employer, Societe Generale, is considered to be a candidate for the next EU country to go tits up? It's unlikely, however, because both Germany (you'll have to plug this aricle into google translator but it basically reports how Germany is helping to fund the French financial system right now: LINK) and the U.S. are taking measures to keep the French financial system solvent, including the Fed injecting $100's of millions into Societe Generale's U.S. subsidiary. As a taxpayer, Michael, you're welcome.
At any rate, the true factors driving the price of gold are: 1) the unstoppable and growing amount of money printing occurring globally; 2) the inability of Governments, especially the U.S. Government, to reign in massive and growing spending deficits; 3) as a result of #2, the growing amount of outstanding direct Government debt being issued and the growing amount of indirect off-balance-sheet liabilities (medicare, Obamacare, pensions, war on terror, etc); growing exposure to and potential catastrophic risk of the Too Big To Fail Bank OTC derivatives exposure.
There are other factors but 1-4 above are the primary drivers. Just for the record, the decelerating - and soon to be tail-spinning down - U.S. economy will unmitigatingly prevent the Fed and the Government from fixing factors 1 thru 3.
What investors should really be afraid of is not the price-action in the gold market - but the underlying reasons for why the Fed orchestrated this paper attack on gold. Recall that in 2008, two months after the metals take-down referenced above, Lehman/AIG/FNM/FRE all collapsed and so began the great financial crisis and the massive Government/taxpayer funding and Fed money printing required to keep the system from completely collapsing and to let the big banks fund massive employee bonuses.
Given the shock and awe nature of this recent take-down, I would suggest that something really ugly - even worse than 2008 - is coming at us in the financial system and it will be just a matter a few months before we find out. I would suggest that the event in Cyprus is likely what re-lit the fuse on the financial system that was stamped out with use of at least $1 billion in direct taxpayer money and, so far, more
GLD liquidation/LBMAAndrew Maguire's accounting of what happened on the LBMA with imminent delivery default as the reason gold was so aggressively taken down is likely 100% correct.
As many of you know, Ted Butler laid out the likelihood of GLD liquidated gold being taken down by the Authorized Participants (bullion banks) in order to replenish the massive drawdown in the Comex stock. There's two problems with this idea:
1) The Comex trades and delivers 100 oz. gold bullion bars. GLD buys primarily 400 oz. LBMA bullion bars. 400 oz bars are no good on the Comex (contractually the bars on the Comex are 100 oz.)
2) The majority of 2mm+ oz drawdown on the Comex has been from the "eligible" account.
I respectfully suggest you guys consider the following:
A piece written by Russell Rhoads, CFA of the CBOE Option Institute - wrote the following:"'Friday was a 4.88 standard deviation move in the price of gold. For simplicity's sake let's call it a five standard deviation move. Statistically we get a five standard deviation move approximately once every 4,776 years. So we should not expect another move like this out of the price of gold until May 17, 6789. ...Currently the two-day price change in GLD is 16.65, which can be converted to just over eight standard deviations. I wanted to share what this comes to, but the table I use only goes up to seven standard deviations. Let's just say the sun is expected to burn out first.'"
Personally, I checked with Dr. Jim Willie [Phd., Statistics, Carnegie Mellon]. He told me the odds of a 7 Std. Dev. Move are 1 in 781 Billion. He went on to add, "there IS NO MATH to calculate the odds of 8+ Std. Deviation moves".
If you are to be taken seriously, you boyz might want to factor some of this math – or lack thereof, into your analysis.
Best,
Rob Kirby
12:36a ET Wednesday, April 17, 2013
Dear Friend of GATA and Gold:
Former Assistant Treasury Secretary Paul Craig Roberts writes today that the U.S. government's rigging of the monetary metals markets is just one aspect of the corruption that now permeates American society. "Save a handful of corrupt banks, screw the American public -- that is the Fed's policy," Roberts writes. "Like almost every other American institution, the Fed represents the mega-rich."
Roberts' commentary is headlined "Update to the Update: The Attack on Gold" and it's posted at his Internet site here:
CHRIS POWELL, Secretary/Treasurer
Gold Anti-Trust Action Committee Inc.
Gold Anti-Trust Action Committee Inc.
A great commentary from Dave /Dave from Denver/The Golden Truth
TUESDAY, APRIL 16, 2013
What The Heck Just Happened To The Metals?
Buy when there's blood in the streets, even if the blood is your own. - Baron Rothschild, 18th century British nobleman and member of the Rothschild banking familyI have to say, for as many people out there who fancy themselves a "contrarian" investor, the amount of kicking and screaming and fear that I've witnessed across all sectors of the investor community is quite staggering. I guess many of you were not around in 2008, when silver and gold were systematically taken down from $21 and $1020 to $8.50 and $700, respectively in a 5 month time period, with most of it coming in July and August that year. And the problem was that back then it was impossible to see what the catalyst would be to create the next bull run. Furthermore, the big Central Banks were still net sellers of gold. In other words, we didn't have the massive bid for physical coming from China (China imported nearly 100 tonnes of gold thru Honk Kong in February) and other big non-NATA countries who are buying gold aggressively.
And I guess very few were around for the early days (2001 - 2004). I remember waking up in the morning and seeing gold down $10 and then watching in horror as the Comex operators took gold down another $10. $20 on a base of $400 is 5%. A 5% intra-day down-swing was not uncommon back then. But not many people watched the sector (CNBC didn't even have a gold price indicator on it's market scroll) so not many remember those days
No one said this sector was going to be easy. After all, gold is the "anti-Christ" of fiat currency-based Governmental and Central Bank systems. It's Dave vs. Goliath, people. The Old Testament tells me that David kicked Goliath's ass.
What just happened in the metals market was a by-product of a creatively planned and well-orchestrated take-down of gold/silver by the Federal Reserve, with the help of the bullion banks (JPM, Goldman, etc) and the unwitting help of the big, computer-driven macro hedge funds. I don't want to go into a play-by-play accounting of the details - it will put you to sleep or many of you would be in disbelief. But I know how manipulation works. I used to help manipulate the junk bond market in the 1990's. I remember the trade that put me on the map at my firm was $10 million face trade of bonds that the RTC had acquired in the S&L liquidation and into a firm owned by the very wealthy owner of one of the NFL football teams. We manipulated that trade in order to create a 50% mark-up from the price we paid the Government to the price we got paid by the smart investor. We had to hold the position overnight to get around the old NASD 5% mark-up rule and convinced the compliance people to look the other way. Back then a $3 million profit on a junk bond trade might compose 30% of the desk P&L for the year. We did that in one trade. Ya the market isn't manipulated...today the numbers involved and degree of illegality is many multiples of what they were 20 years ago. Today we wouldn't have had to hide the trade from compliance until after the cash register was rung.
I have a bone to pick with an article posted on Yahoo yesterday in which some shit-for-brains market "expert" from Societe Generale claims that the "era" of gold is over. You can read his mindless drool here: LINK Here's the commentary that made me roll my eyes:
Gold is a different animal than the rest of the commodities complex, driven primarily by macrodrivers,” and those macro-drivers now are driving gold prices lower... because the macroeconomy looks stronger.Unless this guy, Michael Haigh, is unbelievably stupid, that has to be one of the most intellectually dishonest statements I have ever seen with regard to the relative strength of the economy and the true factors driving gold.
What are the factors Haigh is examining? Is it the recent plunge in retail sales? How about the fact that for the month of January the number of households using foodstamps hit a new record (23 million, which means roughly 20% of all households) LINK. How about the plunge in railcar loadings (I bet most of you weren't aware of that grass-roots economic indicator) LINK How about the fact that over 100 million people in this country are either unemployed or haven't been able to find work for so long that the Government has decided they're not part of the "labor force?" Are those the indicators that Haigh is using in his analysis?
How about the fact the sovereign domicile of Michael's French employer, Societe Generale, is considered to be a candidate for the next EU country to go tits up? It's unlikely, however, because both Germany (you'll have to plug this aricle into google translator but it basically reports how Germany is helping to fund the French financial system right now: LINK) and the U.S. are taking measures to keep the French financial system solvent, including the Fed injecting $100's of millions into Societe Generale's U.S. subsidiary. As a taxpayer, Michael, you're welcome.
At any rate, the true factors driving the price of gold are: 1) the unstoppable and growing amount of money printing occurring globally; 2) the inability of Governments, especially the U.S. Government, to reign in massive and growing spending deficits; 3) as a result of #2, the growing amount of outstanding direct Government debt being issued and the growing amount of indirect off-balance-sheet liabilities (medicare, Obamacare, pensions, war on terror, etc); growing exposure to and potential catastrophic risk of the Too Big To Fail Bank OTC derivatives exposure.
There are other factors but 1-4 above are the primary drivers. Just for the record, the decelerating - and soon to be tail-spinning down - U.S. economy will unmitigatingly prevent the Fed and the Government from fixing factors 1 thru 3.
What investors should really be afraid of is not the price-action in the gold market - but the underlying reasons for why the Fed orchestrated this paper attack on gold. Recall that in 2008, two months after the metals take-down referenced above, Lehman/AIG/FNM/FRE all collapsed and so began the great financial crisis and the massive Government/taxpayer funding and Fed money printing required to keep the system from completely collapsing and to let the big banks fund massive employee bonuses.
Given the shock and awe nature of this recent take-down, I would suggest that something really ugly - even worse than 2008 - is coming at us in the financial system and it will be just a matter a few months before we find out. I would suggest that the event in Cyprus is likely what re-lit the fuse on the financial system that was stamped out with use of at least $1 billion in direct taxpayer money and, so far, more
end
today, Dave talks about the possible default at the LBMA. I also believe that they are out of metal.
(courtesy Dave from denver/the Golden Truth)
As many of you know, Ted Butler laid out the likelihood of GLD liquidated gold being taken down by the Authorized Participants (bullion banks) in order to replenish the massive drawdown in the Comex stock. There's two problems with this idea:
1) The Comex trades and delivers 100 oz. gold bullion bars. GLD buys primarily 400 oz. LBMA bullion bars. 400 oz bars are no good on the Comex (contractually the bars on the Comex are 100 oz.)
2) The majority of 2mm+ oz drawdown on the Comex has been from the "eligible" account.
This is gold being held by investors that is NOT available for delivery. A "replenish" of the "eligible" account wouldn't do any good. And it wouldn't be the market-maker banks who put their gold in the "eligible" account. It would be investors taking delivery of 100 oz. Comex bars and deciding to use the Comex depositories for safekeeping. If anything, the massive drawdown of gold from investor account highlights the fact that sophisticated investors no longer trust the big banks as the custodian of their gold.
What does make sense, especially in light of the news that ABN/Amro defaulted on the physical delivery of the gold in its investor accounts and is settling in cash, is that the LBMA had delivery problems - likely into Asian buyers. Thus, the gold takedown created panic selling a big gold liquidation from GLD that is being used
than $2.2 trillion of printed money.
end
Rob Kirby:
I respectfully suggest you guys consider the following:
A piece written by Russell Rhoads, CFA of the CBOE Option Institute - wrote the following:"'Friday was a 4.88 standard deviation move in the price of gold. For simplicity's sake let's call it a five standard deviation move. Statistically we get a five standard deviation move approximately once every 4,776 years. So we should not expect another move like this out of the price of gold until May 17, 6789. ...Currently the two-day price change in GLD is 16.65, which can be converted to just over eight standard deviations. I wanted to share what this comes to, but the table I use only goes up to seven standard deviations. Let's just say the sun is expected to burn out first.'"
Personally, I checked with Dr. Jim Willie [Phd., Statistics, Carnegie Mellon]. He told me the odds of a 7 Std. Dev. Move are 1 in 781 Billion. He went on to add, "there IS NO MATH to calculate the odds of 8+ Std. Deviation moves".
If you are to be taken seriously, you boyz might want to factor some of this math – or lack thereof, into your analysis.
Best,
Rob Kirby
http://www.zerohedge.com/news/2013-04-17/gold-buying-frenzy-continues-china-japan-and-australia-scramble-physical
Gold Buying Frenzy Continues: China, Japan, And Australia Scramble For Physical
We noted here that the plunge in the paper price of gold (and silver) had prompted considerable renewed demand for physical and now it seems the scramble among the "more stable investor base" is increasing. The shake out of ETFs and futures has left the Australian mint short of deliverables and Japanese andChinese gold retailers seeing a "frenzied" surge in demand. The customers are not just the 'rich' or 'elderly'; in China "they tend to wear water shoes and come directly from the market...;" in Australia, "the volume of business... is way in excess of double what we did last week,... there’s been people running through the gate," and Japanese individual investors doubled gold purchases yesterdayat Tokuriki Honten, the country’s second-largest retailer of the precious metal. The panic selling by a weaker 'imminent inflation-based' investor base has sparked physical shortages- "there’s been significant sales made as people see this as great value." It seems our previous discussions of a rotation from paper to physical were correct and this physical demand will eventually leak back into the paper markets.
Australia (via The Age):
Gold sales from Perth Mint, which refines nearly all of the nation’s bullion, have surged after prices plunged, adding to signs that the metal’s slump to a two-year low is spurring increased demand.“The volume of business that we’re putting through is way in excess of double what we did last week,” Treasurer Nigel Moffatt said, without giving precise figures. “There’s been people running through the gate.”...“There’s been significant sales made as people see this as great value,” Mr Moffatt said. “Gold owners are very reactive to significant market movements.”...The Perth Mint’s sales of gold coins climbed 49 per cent to 97,541 ounces in the three months ended March 31 from a year earlier
China (via China News):
Beijing gold store two hours to sell 20,000 grams of gold bulliontrading volume of nearly 200 million
and (via YCWB):
People have to rush to buy gold, ...gold bullion out of stock yesterday, investors yesterday to spend as much as 600 million yuan to buy 20 kilograms of gold barsThe mad pursuit gold insufficiency is not just a game for the rich. Yesterday, the Yangcheng Evening News reporter learned from the East flowers to Bay store, many growers, pork traffickers, fishmonger recently put down his job went straight to the mall to buy gold.
Japan (via Reuters):
Some Japanese also harbor fears that the expansionary monetary and fiscal policies dubbed "Abenomics", coupled with a national debt more than twice as large as annual economic output, could trigger a crisis down the line.Skeptics about the radical attempt to reflate the economy -- or those simply worried that a slide in the yen that began in anticipation of Abe's election victory last December will continue unabated -- are still buying gold, dealers say."Investors in gold are convinced that Japan's fiscal position will get worse," said Wakako Harada, general manager of Japan's top bullion house, Tanaka Kikinzoku Kogyo."What I see at our counter is that more people are getting worried about Japan. That's why we are seeing a lot of buying."..."In contrast this time, we are seeing interest to buy on dips to take exposures to gold,"..."Investors are using this opportunity to buy gold to diversify beyond bonds, stocks and the yen currency as Japan's fiscal situation could deteriorate."
(via The Age):
Japanese individual investors doubled gold purchases yesterday at Tokuriki Honten, the country’s second-largest retailer of the precious metal.
http://silverdoctors.com/odds-of-comex-default-increasing-exponentially/#more-25188
ODDS OF COMEX DEFAULT INCREASING EXPONENTIALLY
and.....
http://www.caseyresearch.com/gsd/edition/ted-butler-the-price-smash-who-what-how-and-why/
¤ YESTERDAY IN GOLD & SILVER
Except for a brief sell-off that began around 9:00 a.m. in Tokyo on their Tuesday morning, the gold price rallied for the rest of the Far East trading session. This rally continued in London price action as well. But the moment that the gold price broke above $1,400 spot at the Comex open, it ran into a willing seller immediately...and every subsequent rally attempt got sold down...even in the electronic market after the Comex close.
Gold finished the trading day in New York at $1,369.30 spot, up $16.70 from Monday's close...but well of it's high tick of $1,405.60 spot at the 8:20 a.m. Eastern time Comex open. Net volume was monstrous once again...around 449,000 contracts.
Here's the New York Spot Gold [Bid] chart on its own, so you can see the Comex action in more detail.
The silver price chart looked similar to the gold chart. The rally was about the same, but traded on the flattish side between 2:30 p.m. in Hong Kong and 1:00 p.m. in London. The subsequent rally into the New York open broke just above the $24 spot price mark and, like gold, immediately ran into a not-for-profit seller. The silver price never got a sniff of that price level for the rest of the New York trading session.
Silver closed in New York at $23.34 spot...up 65 cents from Monday's close. The high tick [$24.12 spot] came right at the Comex open and, like gold, wasn't allowed to close anywhere near its high. Net volume was a very chunky 77,000 contracts, give or take.
Here's the New York Spot Silver [Bid] price...and you can see that the silver price encountered resistance at every rally attempt as well.
Both platinum and palladium finished higher yesterday, but did not run into the same sort of price interference that was visited upon gold and silver. There was some, but it wasn't applied at the same times, or in the same manner.
For the day, gold finished up 1.23%...silver closed up 2.86%...platinum was up 3.29%...and palladium was up 3.84%. Both gold and silver would have closed materially higher than either platinum or palladium if they hadn't run into a not-for-profit seller at the Comex open in New York yesterday morning.
The dollar index closed on Monday at 82.32...and then chopped higher from there at the Tuesday open in the Far East. It's zenith [82.46] came at precisely 10:00 a.m. in London...and it was all down hill from there, with the low tick [81.73] coming at 2:30 p.m. in New York. From its nadir, the index crept higher, closing the Tuesday session at 81.83...down 49 basis point. It's almost pointless to mention that yesterday's price action in all four precious metals was not affected by any sort of movement in the currency markets.
The gold stocks opened up almost four percent, but ran into selling pressure immediately. Then shortly after 10:00 a.m. Eastern time, the stocks drifted sideways before developing a negative bias around 2:00 p.m. They didn't close on their absolute lows, as a tiny rally just before the close saved them from that fate. As it was, the HUI still finished down 0.64%.
With the odd exception, all the silver stocks finished down on the day, as did Nick Laird's Intraday Silver Sentiment Index. It closed lower by 1.48%.
(Click on image to enlarge)
I'm only speculating here, but I would guess that the negative price action in both the gold and silver stocks probably had something to do with forced mutual fund redemption selling. Once that is out of the way, I expect the precious metal stocks to perform better.
The CME Daily Delivery Report showed that 7 gold and 34 silver contracts were posted for delivery within the Comex-approved depositories on Thursday.
Once again there was a withdrawal from GLD. This time it was 270,815 troy ounces...and as of 9:57 p.m. Eastern time, there were no reported changes in SLV...which is absolutely amazing when you think about the big $3+ price drop that occurred on Monday. I'll wait until Tuesday's changes are reported this evening before I break out the party favours. I have more about GLD and SLV in 'The Wrap' section.
The U.S. Mint had a sales report yesterday. The sold 33,000 ounces of gold eagles...2,500 one-ounce 24K gold buffaloes...but only 503,000 silver eagles.
It was another big day over at the Comex-approved depositories...the second big day in a row. They reported receiving 1,543,323 troy ounce of silver on Monday...and shipped 914,919 troy ounces of the stuff out the door. The link to that activity is here.
It was another huge day at the bullion store again yesterday. We didn't sell quite as much gold as we did on Monday...but sold the same amount of silver. I'd guess that Monday and Tuesday combined were the two biggest back-to-back sales days in the store's history. Cash-and-carry sales were limited even more than they were on Monday...and the wholesalers we buy from were still charging big premiums over spot...and advising of long lead times for delivery. I forgot to mention that the company's website crashed on Monday because of the traffic, but was back up and running by Tuesday morning. Lunch yesterday was comprised of two donuts and a half a cup of Tim Horton's coffee.
I got an e-mail from Bron Suchecki from 'down under' at The Perth Mint last night, so I thought I'd ask him how business was going. His reply was..."Same, retail demand is crazy, Depository less so, with a little selling back...but overall net buying."
While we're in Australia, here are a couple of charts courtesy of our good friend Nick Laird from Cairns. Both are self-explanatory and clearly marked. He sent me the first one...and I stole the second one while I was on his site.
(Click on image to enlarge)
(Click on image to enlarge)
Here's some must read commentary on gold by Dennis Gartman. I extracted this from a GATA release early yesterday afternoon...
"Concerning gold, let's note firstly something sent to us by our old friend John Brimelow, who had a most interesting piece in his commentary this morning regarding the violence of the recent price changes. He noted a piece written by Russell Rhoads, CFA of the CBOE Option Institute, who wrote the following:
"'Friday was a 4.88 standard deviation move in the price of gold. For simplicity's sake let's call it a five standard deviation move. Statistically we get a five standard deviation move approximately once every 4,776 years. So we should not expect another move like this out of the price of gold until May 17, 6789. ... Currently the two-day price change in GLD is $16.65, which can be converted to just over eight standard deviations. I wanted to share what this comes to, but the table I use only goes up to seven standard deviations. Let's just say the sun is expected to burn out first.'"
Gartman continues: "We shall confidently say that we will never, ever see a day such as we saw yesterday in the gold market in our lifetime again. It will not happen. The sun will indeed burn out before we see anything such as that again. Nor shall we ever want to see anything such as that again. We can reasonably deal with deviations from the norm of 2 or 3 or perhaps even 4, but 8+ standard deviations is beyond our ken or that of anyone else anywhere. Yesterday's price action will go down in history as an aberration of truly historic proportions.
"We judge the violence of the market's movements by the numbers of requests for interviews made of us, for the correlation between high numbers of such requests is nearly 1:1 with peaks and valleys of various markets. A large number of requests made of us is four or five a day; a truly large number is eight. Yesterday we had twelve, and we've agreed to give several more today that we could not fit into our schedule yesterday. This befits an 8+ standard deviation day."
[Ah, yes, "an aberration of truly historic proportions" -- but while central banks are the biggest gold traders, that aberration was still not large enough to prompt Gartman to put a question to a central bank or two. Yes, in that respect as well, the sun will burn out first. - Chris Powell]
* * *
Selected news and views.....
Five King World News Blogs
1. Pierre Lassonde: "Legendary Pierre Lassonde Weighs in on Gold Takedown". 2. Gerald Celente: "Speaks Out About Largest Gold Smash in 30 Years". 3. Richard Russell: "Gold Plunge, Billionaires and a Market Crash". 4. John Embry: "Gold and Silver Takedown and the Impact on Investors". 5. Tom Fitzpatrick: "Recent Stunning Gold Plunge vs. 1970s and What to Expect Next".
Peter Grandich: It Feels Like October 20, 1987
On October 20, 1987, I was just 31 years old and in the brokerage business a whopping three years. I was working for a NYSE member form at the time and had just been promoted to Head of Investment Strategy a few months earlier. Back in August, I had written to our clients and in my newsletter that I envisioned a stock market crash. By October 19th, one had occurred.
I remember walking into our office in Eatontown NJ very early the morning of the 20th. The mood was grim and fear of a further meltdown was widespread. For whatever reason(s), I decided to state that the worse was over and we could see a new, all-time high within a couple of years. I still recall the universal disbelief that such a feat could take place given what had just occurred.
Nothing has come close to that dismal feeling of hopelessness for a market in all the market swoons since then until yesterday. Total despair regarding mining and exploration stocks is widespread. This group had already been in a horrific bear market before gold and silver crater late last week and yesterday.
This very short must read commentary by Peter was posted on his website in the wee hours of yesterday morning.
The Telegraph: The gold price crash is further evidence of market rigging
The facts in the public domain do not justify the sharp fall in the gold price over the past two trading days.
At the time of writing, the price per 100 ounces is $1,363, down over $200 since Friday's open. The scale of the sell-off was the worst in 30 years, with the volatility index standing at the highest level in its history.
John Kemp at Reuters has calculated that based on a normal distribution, you would expect to see movements like Monday's only once in every 500 million trading days, or two million years. The news which would justify such a price swing is curiously absent -- in fact, my view is that the market ought to be bullish for gold. Something doesn't add up.
This blog was posted on the telegraph.co.uk Internet site yesterday sometime...and it certainly falls into the absolute must read category. I found it embedded in a GATA release yesterday.
Paul Craig Roberts: Attack on gold is just part of pervasive corruption
Former Assistant Treasury Secretary Paul Craig Roberts writes that the U.S. government's rigging of the monetary metals markets is just one aspect of the corruption that now permeates American society. "Save a handful of corrupt banks, screw the American public -- that is the Fed's policy," Roberts writes. "Like almost every other American institution, the Fed represents the mega-rich."
Roberts' commentary is headlined "Update to the Update: The Attack on Gold" and it was posted at his Internet site paulcraigroberts.org yesterday. It's another article I found in a GATA release.
India's Response To The Gold Sell Off: A Massive Buying Frenzy
Bloomberg reports of the immediate aftermath to the past few days' gold plunge: "Gold buyers in India, the world’s biggest consumer, are flocking to stores to buy jewelry and coins, betting a selloff that plunged bullion to a two-year low may be overdone."
Wait, so instead of jumping out off high buildings, Indians are being cool, calm and collected and... buying more? Impossible. Do they not get CNBC in Mumbai? Apparently not: "My daughter is just six months old, but I think it is never too early to buy gold,” said Sharmila Shirodkar, a 28- year-old housewife, while displaying a new pair of earrings she bought from a store in Mumbai’s Zaveri Bazaar. “I had been asking my husband every day if prices will go down more. I couldn’t wait anymore.”
This Zero Hedge piece from yesterday is worth the read if you have the time...and I thank reader 'David in California' for sharing it with us.
Patrick Heller: Physical Bullion Demand on Fire
[Monday] in our store, the further price drop brought out even more eager buyers of precious metals. Even though we recently moved to much larger quarters (the size of the showroom quadrupled and we added several phone lines), customers were waiting as long as 30-60 minutes to be served. Many people simply could not get through on the telephone lines because they were jammed with calls.
The premium over silver value on $1,000 bags of U.S. 90 percent silver coin topped 20 percent. Dealers and wholesalers have almost nothing in stock for immediate delivery and premiums are rising across the board.
Because of slowing deliveries on bullion-priced physical gold and silver coins and ingots, we had to implement a limitation of $5,000 in sales to new mail-order customers. We accepted orders from established mail-order customers and from in-store customers who were ready to made immediate payments. (Note: there is value in having a relationship with a coin dealer who will take care of you on days like today rather than risking not being able to trade at all because a dealer doesn’t know you.)
For whatever reason, this article, posted on the numismaster.com Internet site, is in very small type...so some of you may need a magnifying glass to read it. I thank West Virginia reader Elliot Simon for bringing it to my attention...and now to yours.
Ted Butler: The Price Smash – Who, What, How and Why?
There is no doubt that we are at a critical juncture in gold and silver...and the first order of business is to drill down to how and why prices plunged so much Friday and Monday. Certainly, more commentary (mostly on gold) is being written about the precious metals currently in regards to the price weakness than I can remember.
Unfortunately, much of the analyses and commentary is wide of the mark, in my opinion. But the great thing is that everyone interested in what just took place with gold and silver prices can decide for themselves from the multitude of opinions offered as to what makes the most sense.
For me, explaining what took place is easy, since the price plunge occurred in the confines of how I analyze gold and silver. First, what exactly did happen? Basically, a neutron price bomb was detonated in certain NYMEX/COMEX markets that selectively targeted gold, silver, copper, platinum, palladium and crude oil prices. On just about every other market, like stocks, bonds, currencies, grains, meats, soft commodities yesterday was non-eventful pricewise. The importance of this distinction that only selected markets experienced unusual price weakness is that it eliminates many general knee-jerk explanations about prices being impacted by broad macroeconomic factors.
How could broad economic factors influence certain commodities and not the stock or currency markets? Looking deeper, the commodities experiencing price weakness all have different supply/demand fundamentals relative to one another, so as to eliminate the possibility that all those unique fundamentals changed yesterday in synch. Commodity fundamentals change glacially; it’s impossible for the supply/demand equation of many various commodities to change overnight.
If I had to pick just one story for you to totally immerse yourself in today...this would be the one. Silver analyst Ted Butler posts very little in the public domain, but when he does, it always falls in the absolute must read category...and this essay is certainly no exception. This time I don't have to steal anything from him, as he exposes the true inside workings of the precious metal markets...plus copper and crude oil...for all to see. I consider his 15-year body of work in this area to be definitive. This essay is definitely worth reading more than once.
¤ THE WRAP
So, if it wasn’t [an] abrupt change in the fundamental story in the various separate markets that were hit to the downside on Friday, then what the heck accounted for the steep declines in price? Stated differently, what was the common denominator present in the markets that plunged? The most visible common denominator was that the various big price declines occurred on the NYMEX/COMEX markets owned and run by the CME Group. But the most important common denominator was the nature of the buyers and sellers across all the markets that got smashed. Without exception, in any market that declined significantly on Friday, the big net buyers were the traders classified as commercials and the big net sellers were those traders classified as non-commercials, largely technical trading funds. Not only was this true on Friday, it has been true on every single big price decline throughout history, according to US Government data (COT reports). - Silver analyst Ted Butler...13 April 2013
Well, I got my wish, the precious metals didn't come roaring back yesterday. They did in both gold and silver, but their respective rallies got stepped on at the 8:20 a.m. Eastern time Comex open...and that, as they say, was that.
I'd guess that the bottom was in, in early morning trading in the Far East on their Tuesday...and that we won't be going lower from here, as the bullion banks pretty much cleaned out every technical fund long position left in the Comex futures market...and I await confirmation of that fact in Friday's Commitment of Traders Report.
One thing I did notice yesterday was that there were almost no changes in total open interest in either gold or silver on Monday's trading day...and Ted figures that JPMorgan et al hid their tracks pretty well by using spread trades. But all their activities, regardless of what they are, will become far more obvious in Friday's report.
Ted is also of the opinion that not only did the banks buy up every long futures contract that was dumped on the Comex during the last three days, but they also scooped up all the physical gold and silver that was withdrawn from both GLD and SLV...including all the shares of each as well. And I guess that would include the mining shares as well.
As Chris Martenson so correctly pointed out in a story in the 'Critical Reads' section further up, what we were witness to on those three days just past, was "a massive wealth transfer from our pockets to the banks."
So where we go from here...and how high and how fast...is still up to JPMorgan et al...but this time they are positioned on the long side of the precious metal markets, not the short side. It will be interesting to see how this power manifests itself over time.
But use this power they will...and with the technical funds holding a record short-side position in the Comex futures market, the next major upside price move will certainly have the potential to take your breath away, if that's what the bullion banks have planned. If/When that time does arrive, you will either be all the way in...or all the way out.
Don't forget that there are no daily price limits in either gold or silver...a Comex rule change that was made quietly over twenty years ago and, without doubt, we'll see put to good use the day this bull market in the precious metals reaches its zenith.
However, until that time arrives, we'll just have to wait it out. But while you're doing that, I would certainly be quietly buying as much of the physical metal as you can, because when we do get the above-mentioned event, the precious metal prices will be marked up so high, so fast, that the world will become sellers, not buyers...and silver will be the new gold.
Not much happened in overnight trading in the Far East...and it's the same now that London has been open a couple of hours. All four precious metals aren't doing much...but volumes are still very impressive in gold and silver...north of 60,000 contracts in gold and north of 12,000 [net] in silver. The dollar index is up about 20 basis points as I hit the 'send' button on today's offering...but as I've stated before, the currency markets are not driving the precious metal prices at the moment. But they might at some point in the future.
That's all I have for today...and I'll see you here tomorrow.
Ted Butler's full missive........
http://www.silverseek.com/commentary/price-smash-%E2%80%93-who-what-how-and-why-10991
The Price Smash – Who, What, How and Why?
|
April 16, 2013 - 1:19pm
There is no doubt that we are at a critical juncture in gold and silver and the first order of business is to drill down to how and why prices plunged so much Friday and Monday. Certainly, more commentary (mostly on gold) is being written about the precious metals currently in regards to the price weakness than I can remember. Unfortunately, much of the analyses and commentary is wide of the mark, in my opinion. But the great thing is that everyone interested in what just took place with gold and silver prices can decide for themselves from the multitude of opinions offered as to what makes the most sense.
For me, explaining what took place is easy, since the price plunge occurred in the confines of how I analyze gold and silver. First, what exactly did happen? Basically, a neutron price bomb was detonated in certain NYMEX/COMEX markets that selectively targeted gold, silver, copper, platinum, palladium and crude oil prices. On just about every other market, like stocks, bonds, currencies, grains, meats, soft commodities yesterday was non-eventful pricewise. The importance of this distinction that only selected markets experienced unusual price weakness is that it eliminates many general knee-jerk explanations about prices being impacted by broad macroeconomic factors. How could broad economic factors influence certain commodities and not the stock or currency markets? Looking deeper, the commodities experiencing price weakness all have different supply/demand fundamentals relative to one another, so as to eliminate the possibility that all those unique fundamentals changed yesterday in synch. Commodity fundamentals change glacially; it’s impossible for the supply/demand equation of many various commodities to change overnight.
So, if it wasn’t abrupt change in the fundamental story in the various separate markets that were hit to the downside yesterday, then what the heck accounted for the steep declines in price? Stated differently, what was the common denominator present in the markets that plunged? The most visible common denominator was that the various big price declines occurred on the NYMEX/COMEX markets owned and run by the CME Group. But the most important common denominator was the nature of the buyers and sellers across all the markets that got smashed. Without exception, in any market that declined significantly, the big net buyers were the traders classified as commercials and the big net sellers were those traders classified as non-commercials, largely technical trading funds. Not only was this true yesterday, it has been true on every single big price decline throughout history, according to US Government data (COT reports).
This may seem elemental, but I ask you to contemplate this anew. In the highly-charged emotional state of significant price declines, it is tempting to accept fabricated stories as to what may be the cause of the declines. Because of that, it is more important than ever to rely on the known facts and only that which can be substantiated. COT data have and will show without question that the commercials are always the big buyers and the technical funds are always the big sellers and there was no exception this time. Once you know who the big buyers and sellers are (which is the beauty of the COT), only then can you proceed to the how and why of the big price declines.
Armed with the certain knowledge that in every market that declined substantially the big buyers were the commercials with the big sellers as the technical funds, how and why fall into place. Why is real easy – in order to make money. The way one makes money is by buying low and selling high, although not necessarily in that order. For instance, JPMorgan the big concentrated short seller and manipulator of silver and other markets, has made a boatload of money, many hundreds of millions of dollars, by short selling at higher prices than the prices they have been buying back at. I don’t begrudge JPMorgan for making large trading profits if they were doing so legally, but that is not the case. The trading profits being made by JPMorgan and the other commercials are as far from legal as is possible. That’s the only plausible conclusion a reasonable person could reach when answering the last open question – how do they do it?
Knowing who the buyers and sellers are and why, all that’s left is the how. Simply stated, JPMorgan and the commercials have captured control of the mechanism that sets short term prices, by means of High Frequency Trading (HFT), which dominates modern electronic trading. Whenever JPMorgan and the commercials wish to set prices for any market sharply higher or lower, they can and do set those prices. That is an incredibly powerful trading advantage. Since the technical funds, which are always the counter parties to JPM and the other commercials, rely on price changes to initiate their buying and selling, these funds are, effectively, controlled by JPMorgan and the commercials.
Sunday night was a classic example in that JPMorgan and the commercials kept setting lower and lower prices in the NYMEX/COMEX commodities mentioned to induce more and more technical fund selling so that JPM and the commercials could and did buy. The commercials knew there was residual margin call liquidation for Monday morning, following Friday’s rout, so rather than let panicky margin call sellers out with additional losses of 50 cents in silver or $20 in gold, the commercials rig prices lower in thin Sunday night Globex dealings by $3 in silver and close to $100 in gold. This is similar to the May 1, 2011 Sunday night $6 massacre in silver. The only difference is that this time the commercials took all other important NYMEX/COMEX markets down with silver.
The proof that this is how the market operates can be seen in current and historic COT data in that on big declines in price the commercials are always big buyers and technical funds are big sellers. In fact, I don’t know that there can be an alternative explanation based on actual data. Of course, there is no way a small group of large banks and financial firms could be continuously pulling this trading scam off without prearrangement and collusion. And of course, this collusion and price control is against the law and any sense of fair trade. We actually have in place a federal regulator, in the form of the CFTC and a self-regulator in the CME, specifically created to combat the trading operations I just described, who both refuse to end the ongoing scam.
Clearly, the main impetus behind Monday’s price decline is margin call liquidation by those holding long futures contracts. Although I’ve always warned not to hold silver on margin, at times like this I kick myself for not having warned more forcefully. The $200 gold and $5 silver move over the past two days has resulted in most holding long gold and silver futures contracts to be forced to immediately deposit $20,000 to $25,000 for each contract held or be sold out by their brokers. These demands for such large amounts of money have resulted in an avalanche of panic selling. And it matters little if you believe, like me, that there was an intent behind the extreme price declines or if the margin call selling was spontaneous and beyond intent. In the end, there can be no question that gold and silver (and copper, platinum, palladium and oil) are down today due to extraordinary trading activity on the NYMEX/COMEX, led by margin call selling.
If you accept the premise that massive margin calls are at the center of today’s price decline, the next question is when will the margin call selling end? We know from market history that such selling must burn itself out fairly quickly. This is particularly true in COMEX gold, copper and silver, since there was not a large relative speculative long position to begin with, following months of speculative net long liquidation and new short selling. I don’t think that technical funds are adding aggressively to short positions today since current prices are so far below the popular moving averages so as to make the normal stop loss points above too excessive for prudent risk taking. This looks like plain-vanilla leveraged long liquidation in which the selling pressure has reached a climax and, therefore, must soon end. Prices will stop going down when the margin call liquidation, principally on the COMEX, ends.
The next question is what happens when prices stop going down and the margin call selling burns itself out. In other words, what does the next price rally look like; will we go up slowly or with a rush? No one knows for sure, but the possibility exists that prices could rocket higher. Certainly, any market that can fall 10% in a day can rise by that amount (or more) as well. But what improves the odds of a rush to the upside is the incredible degree of commercial buying that has taken place in the markets that have been smashed. We’ll have to wait until this week’s COT report, but there appears little doubt that it will indicate more record net commercial buying as has been the case for weeks and months. Since I’m convinced beyond question that the price of silver has been manipulated by the big commercials on the COMEX, watching them buy aggressively suggests they could let the price rip to the upside with the same intensity that they’ve orchestrated to the downside.
With the record-setting trading volume Monday and on Friday, I would not be surprised if JPMorgan had eliminated its concentrated silver short position. I think it obscene that the CFTC and the CME have stood by and allowed JPMorgan and the other crooked commercials to disrupt the orderly functioning of the markets, but this is nothing new. The reality is that JPMorgan and their collusive partners are better positioned for a price rally in silver and other markets like never before.
As painful as the severe price declines have been, at least holders of fully-paid for silver retain the option of holding without having to deposit large sums of capital or lose their position. I know that I’m holding, in addition to holding call options. This is, unfortunately, not an option for holders of leveraged metal in the form of futures contracts. While it is true that a good number of leveraged longs have been forced from the market and are unlikely to buy anytime soon, that is not a factor necessary for silver prices to climb in the future. The ultimate resolution for silver prices has always depended upon the physical market. In terms of the physical market, the severe price declines would suggest the physical resolution should be accelerated.
Every free market economic principle holds that lower commodity prices increase demand and curtail supply. Clearly, the sudden price decline in silver is not causing miners to rush into increasing production. And as soon as prices stabilize (which I think is very soon), buying pressure will increase to take advantage of the sudden bargain prices.
Ted Butler
April 16, 2013
No comments:
Post a Comment