http://www.nakedcapitalism.com/2013/04/linchpin-pro-austerity-paper-rife-with-errors-recomputed-results-show-no-growth-hit-from-high-government-debt.html
http://www.telegraph.co.uk/finance/economics/10001885/Row-erupts-over-study-into-public-debt-as-economists-turn-on-Rogoff-and-Reinhart.html

TUESDAY, APRIL 16, 2013
Linchpin Pro-Austerity Paper Rife with Errors; Recomputed Results Show No Growth Hit from High Government Debt
There appears to be no intellectually honest defense of austerity left standing.
The IMF has already ‘fessed up that it does not work in practice, that cutting government spending when growth is weak simply leads the economy to contract further, making debt to GDP levels even worse than before. That admission was based on the miserable results it has produced when implemented.
But now, a new paper by Thomas Herndon, Michael Ash and Robert Pollin of PERI, “Does High Public Debt Consistently Stifle Economic Growth? A Critique of Reinhart and Rogoff,” is a devastating takedown of the factoid commonly bandied about by austerians, that if government debt rises above 90% of GDP, growth suffers. That belief in turn was based on a paper “Growth in the Time of Debt” by Carmen Reinhardt and Kenneth Rogoff, which did a 20 country comparison from 1946 to 2009. This paper claimed that when debt rose over the scary 90% to GDP level, growth fell to -0.1%.
Turns out that is not true. A number of economists had challenged the findings for asserting causality when all it showed was a correlation. In addition, a number of economists tried replicating the Reinhart-Rogoff results for years, with no success. Reinhardt and Rogoff refused to share their underlying computations. Five years later, now that the Reinhart/Rogoff work is widely accepted as true, they finally sent their “working spreadsheet” to the PERI team. As Herndon, Ash, and Pollin report:
Our finding is that when properly calculated, the average real GDP growth rate for coun- tries carrying a public-debt-to-GDP ratio of over 90 percent is actually 2.2 percent, not −0.1 percent as published in Reinhart and Rogoff. That is, contrary to RR, average GDP growth at public debt/GDP ratios over 90 percent is not dramatically different than when debt/GDP ratios are lower.
So the widely touted finding is wrong on its face. The paper goes through a litany of what is wrong with their analysis. The biggest gaffe is a spreadsheet error which rather conveniently omitted five countries, Australia, Austria, Belgium, Canada, and Denmark, entirely. The paper stresses that this omission was necessary to achieve the negative-growth finding. The paper describes what it calls a “coding error”:
The omitted countries are selected alphabetically and, hence, likely randomly with respect to economic relationships. This spreadsheet error, compounded with other errors, is responsible for a −0.3 percentage- point error in RR’s published average real GDP growth in the highest public debt/GDP category. It also overstates growth in the lowest public debt/GDP category (0 to 30 percent) by +0.1 percentage point and understates growth in the second public debt/GDP category (30 to 60 percent) by −0.2 percentage point.
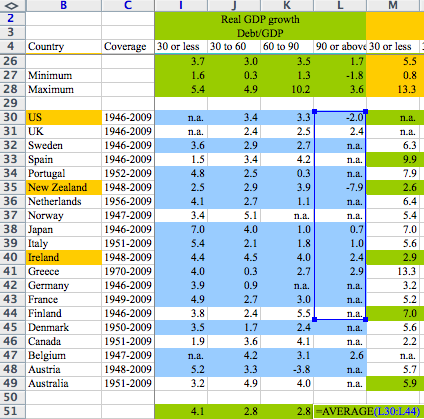
Mike Konczal obtained a copy of the spreadsheet. As he explained:
Being a bit of a doubting Thomas on this coding error, I wouldn’t believe unless I touched the digital Excel wound myself. One of the authors was able to show me that, and here it is. You can see the Excel blue-box for formulas missing some data:
And although the most glaring problem, it’s far from the only one. The authors found other, um, irregularities.
Reinhardt and Rogoff omitted data. The PERI authors note the cases when data was not in the spreadsheet because it was not available. But there were important cases when the information was simply not included. To wit:
More significant are RR’s data exclusions with three other countries: Australia (1946– 1950), New Zealand (1946–1949),and Canada (1946–1950).4 The exclusions for New Zealand are of particular significance. This is because all four of the excluded years were in the highest, 90 percent and above, public debt/GDP category. Real GDP growth rates in those years were 7.7, 11.9, −9.9, and 10.8 percent. After the exclusion of these years, New Zealand contributes only one year to the highest public debt/GDP category, 1951, with a real GDP growth rate of −7.6 percent. The exclusion of the missing years is alone responsible for a reduction of −0.3 percentage points of estimated real GDP growth in the highest public debt/GDP category.
On top of that, all data was not treated equally. Reinhardt and Rogoff weighted the sample in a way that gave the negative growth findings more significance than appears warranted.
As the PERI team explained, the paper did a simple comparison, lumping experience into four buckets: when government debt to GDP was 0-30%, 30%-60%, 60% to 90%, and over 90%. But within each bucket, they bizarrely weighted each sample by country rather than by the number of data points. The authors explain the consequences:
After assigning each country-year to one of four public debt/GDP groups, RR calculates the average real GDP growth for each country within the group, that is, a single average value for the country for all the years it appeared in the category….RR does not indicate or discuss the decision to weight equally by country rather than by country-year. In fact, possible within-country serially correlated relationships could support an argument that not every additional country-year contributes proportionally additional information. Yet equal weighting of country averages entirely ignores the number of years that a country experienced a high level of public debt relative to GDP. Thus, the existence of serial correlation could mean that, with Greece and the UK, 19 years carrying a public debt/GDP load over 90 percent and averaging 2.9 percent and 2.4 percent GDP growth respectively do not each warrant 19 times the weight as New Zealand’s single year at −7.6 percent GDP growth or five times the weight as the US’s four years with an average of −2.0 percent GDP growth. But equal weighting by country gives a one-year episode as much weight as nearly two decades in the above 90 percent public debt/GDP range. RR needs to justify this methodology in detail. It otherwise appears arbitrary and unsupportable.
And you get a double-whammy: remember that New Zealand had three years of good growth with high debt to GDP levels that were omitted, so the -7.6% is an even greater overstatement. And the PERI authors stress, while the interaction of the mistakes does not affect the below 90% categories much (you get 4% growth in the lowest category and more or less 3% in the next two), it changes the outcome completely in the top category.
Dean Baker, who has long been a skeptic of the Reinhardt/Rogoff work, reminds readers of other reasons the work was sus, that of the causation we mentioned at the outset. Low growth is often the result of factors having nothing to do with government debt levels. Just look around you. We are in a balance sheet crisis of low growth as a result of a global financial crisis that was the result of too muchprivate debt, most importantly at undercapitalized financial institutions. The rise in debt level was not the result of “profligacy” but of tax revenues collapsing as a result of the crisis, and spending under various programs increasing (notably unemployment-related programs). And the overwhelming consensus is outcomes would have been worse absent the automatic increase in government spending. Yet the Reinhardt-Rogoff prescription would have you believing the reverse.
Baker points out some of the earlier data points that similarly support the “high debt is bad” thesis don’t stand up to scrutiny:
There are all sorts of good reasons for questioning this logic. First, there is good reason for believing causation goes the other way. Countries are likely to have high debt-to-GDP ratios because they are having serious economic problems.Second, as Josh Bivens and John Irons have pointed out, the story of the bad growth in high debt years in the United States is driven by the demobilization after World War II. In other words, these were not bad economic times, the years of high debt in the United States had slow growth because millions of women opted to leave the paid labor force.
And you have another apples and oranges problem, of mixing sovereign currency issues with countries that don’t control their currencies. De facto gold standard countries do have a hard time managing high debt levels, since they can only borrow to fund government debt, and as the periphery European countries show, will be subject to higher interest rates, which then makes financing costly throughout the entire nation.
The good news is the paper has gone viral. Even non-economic sites have picked up on it and are flagging that the “error” has been hugely destructive, to wit, ars technica: Microsoft Excel: The ruiner of global economies? And Reinhardt and Rogoff seem to be engaging in desperate defenses. They contend in their initial response that the recomputation by Herndon, Ash, and Pollitt still supports their thesis that high debt levels are negative for growth. But this is disingenuous. There is a HUGE difference between showing a negative finding, of recessionary outcomes, versus an average of 2.2% growth for an advanced economy, which is considered to be an entirely respectable, if not exciting, growth rate. This is typical of the sort of thing Reinhardt and Rogoff said about their findings. From a Financial Times comment in 2010 titled No need for a panicked fiscal surge:
Indeed, it is folly to ignore the long-term risks of already record peace-time debt accumulation. Even where Greek-style debt crises are unlikely, the burden of debt will ultimately weigh on growth due to inevitable fiscal adjustment. The fact that the markets seem nowhere near forcing adjustment on most advanced economies can hardly be construed as proof that rising debts are riskless. Indeed, the evidence generally suggests that the response of interest rates to debt is highly non-linear. Thus, an apparently benign market environment can darken quite suddenly as a country approaches its debt ceiling. Even the US is likely to face a relatively sudden fiscal adjustment at some point if it does not put its fiscal house in order.
The “debt ceiling” is a coded reference to the 90% threshold in their paper, which they reference in the preceding paragraph. But as we indicated, those “ceilings” and “non-linear” outcomes have been observed in de facto gold standard countries.
Similarly, Reinhardt and Rogoff deny that they ever asserted causality in their paper. And in fact, they appear to have trod that line carefully. But they have certainly insinuated that debt in and of itself is a problem as opposed to a symptom. For instance, from a Bloomberg op ed in 2011 (hat tip Lambert, emphasis ours):
Our empirical research on the history of financial crises and the relationship between growth and public liabilities supports the view that current debt trajectories are a risk to long-term growth and stability, with many advanced economies already reaching or exceeding the important marker of 90 percent of GDP.
Readers are welcome to correct me, but I also do not recall a single time seeing either Reinhardt or Rogoff clearing their throats in public and saying their paper only showed a correlation. Both have written regularly and spoken out in favor of cutting debt levels as desirable and necessary. For them to claim they didn’t mean to claim causality is astonishing.
Now in fact there is a reason to be concerned about the artificially low interest rates the Fed has and is certain to continue to engineer. They are a massive transfer from savers to the financial system and to speculators on asset prices. But the solution is more demand and more investment, and if the private sector won’t provide it, government needs to step in. The evidence, as even the IMF has been forced to acknowledge, is that government spending is stimulative, and with a fiscal multiplier over 1 (which is also what the IMF found is operative in low growth economies), spending makes the denominator of the debt/GDP grow faster than the numerator, reducing rather than increasing debt ratios.
But the damage is already done. The establishment is too deeply invested in austerian thinking to change courses. How many times have we heard Obama make remarks along the lines of these from his 2011 Facebook town hall meeting:
So now what we’ve got is a situation not only do we have this accumulated debt, but the baby boomers are just now starting to retire. And what’s scary is not only that the baby boomers are retiring at a greater rate, which means they’re making greater demands on Social Security, but primarily Medicare and Medicaid, but health care costs go up a lot faster than inflation and older populations use more health care costs. You put that all together, and we have an unsustainable situation.So right now we face a critical time where we’re going to have to make some decisions how do we bring down the debt in the short term, and how do we bring down the debt over the long term.
Reinhardt and Rogoff legitimated the backwards idea that debt is the problem. No, growth is the problem (now we can debate how to achieve growth in the face of current and prospective resource constraints, but that is a different conversation. A space race level push for a combination of energy conservation, which BP found increased its profits dramatically, and accelerating the use of less damaging energy sources alone would provide some economic impetus). The level of real (as opposed to official) unemployment shows how bad things are and how more needs to be done. Dean Baker describes the high human cost of the Reinhardt and Rogoff snake oil:
This is a big deal because politicians around the world have used this finding from R&R to justify austerity measures that have slowed growth and raised unemployment. In the United States many politicians have pointed to R&R’s work as justification for deficit reduction even though the economy is far below full employment by any reasonable measure. In Europe, R&R’s work and its derivatives have been used to justify austerity policies that have pushed the unemployment rate over 10 percent for the euro zone as a whole and above 20 percent in Greece and Spain. In other words, this is a mistake that has had enormous consequences.
But as Max Planck said, “Science advances one funeral at a time.” The same is certain to be true of economics and policy orthodoxies. Despite the IMF having said austerity is a crock, the Troika continues to tighten the noose around the necks of periphery countries, even as economic indicators in Germany continue to weaken. Obama is too deeply invested in making deficit cutting and putting Social Security and Medicare on a path to destruction to reverse course. The one benefit of this decisive debunking of the Reinhardt and Rogoff paper is it will be impossible for him to defend his actions as merely following the advice of experts. The experts have been shown to be wildly wrong, and any decision to follow their faulty analysis now rests squarely on Obama and his fellow travelers.
http://www.telegraph.co.uk/finance/economics/10001885/Row-erupts-over-study-into-public-debt-as-economists-turn-on-Rogoff-and-Reinhart.html
Row erupts over study into public debt as economists turn on Rogoff and Reinhart
A paper by two leading economists that was used by George Osborne to justify austerity measures in Britain contains "serious errors", rivals have claimed.

7:07PM BST 17 Apr 2013
 31 Comments
Growth in a Time of Austerity, by Harvard University profesors Ken Rogoff and Carmen Reinhart, has been called into question amid claims that it overstates the threat posed to economic growth by the level of government debt.
“Coding errors, selective exclusion of available data and unconventional weighting of summary statistics lead to serious errors,” according to a seperate paper by economists at the University of Massachusetts.
Instead of shrinking at an average of 1pc a year - the conclusion of the wide-ranging examination of countries since the Second World War by Professors Rogoff and Reinhart - economies with a debt to GDP ratio of 90pc or more have actually expanded at an average rate of 2.2pc, according to the paper from the University of Massachusetts.
The accusations unleashed an intense online debate among economists, but may also ripple out beyond the profession.
More than four years since the financial crisis, the debate in the West over where the right balance between growth and austerity lies shows little sign of abating.
In a defence of the paper that they later developed into a book, Professors Rogoff and Reinhart admitted on Wednesday that an “accidental” omission of countries from the first five letters of the alphabet from one data series led to the average growth rates of the economies it surveyed being depressed. However, the academics rejected in the “strongest terms” suggestions they had manipulated data to reach conclusions.
Weeks after Growth in a Time of Austerity was published in January 2010, George Osborne, who was preparing to become Chancellor, cited the 26-page-long text in a speech to prepare the ground for spending cuts and tax rises.