http://hat4uk.wordpress.com/2014/02/27/crash2-why-its-going-to-be-a-bloodbath-on-four-fronts/
 Blackrock was very bearish about the stock markets earlier this week. ‘Well I don’t know about Blackrock, but I’ve been counting signs since last October – and they all say The Top Is Coming’ was my response in yesterday’s Slogpiece about – among other things – idiots buying Greek shares “because they’re cheap”. As the week unfolds, opinion leaders are lining up to warn the greedy that it’s time to move out.
 Ah well, that’s a bit more to add to the National Debt. But it isn’t holding the Great Fraudster back in his career: now boss at RSA, Hest the Pest is to bolster its capital by between £1.5-1.6bn over the next three years…using a £775m discounted rights issue and the cancellation of the final dividend for 2013 in order to do it.
The changes will during 2014 mean that:
I simply believe that China leads the world. They took the burden of world growth in their hands during the peak of the crisis in 2008/09 through the biggest fiscal expansion ever seen (550 billion US Dollars), then they increased their investment to GDP ratios securing export orders for major European and US exporters until late 2013, but since the Third Plenary Session of the 18th CPC Central Committee in November 2013 the main objectives for the political elite in China have changed from growth and export to rebalancing, fighting graft, reducing pollution and betting a small crisis now is better than a big one later.
I have already spent considerable amount of ink explaining why China is proactively seeking a small crisis rather than a big one and how China can no longer afford to keep its investment to GDP levels excessive but now China seems to have engaged in a fundamental change to its FX rates – attempting to weaken the CNY [Yuan].
China is a long term critic of Abenomics and the ensuing devaluations as Japan and Korea remains its key competitors in the export market, but until last week China held their FX tight and tightening but now things have changed:

Source: Bloomberg LLP & Saxo Bank
With the present geopolitical tension between China and Japan this chart is cause for concern for all of us: China no longer will play ‘nice’, they are this time ignoring “best practice” of playing paying lips service to the US-Sino relationship. Clearly Obama once again receiving the Dalai Lama in the White House is not helping the situation. That the rally in USD-CNY happened almost to the day Obama hosted the Dalai Lama is of course a pure coincidence! (They met Friday February 20th!)
China is not happy these days: The domestic economy needs rebalancing with the risk for upsetting the population and the bureaucrats. Overseas, Japan’s Abe is insisting on a stronger Japan, the US is clearly ignoring China advice on the Dala Lamai and overall the G-20 meeting had the developed world blaming the recent slow-down on the EM.
Not a good month for monetary coordination and friendly summits. The political crisis is biting ironically at a time where stock markets across the world is reaching 5, 7, and in the case of the UK 14 year highs! My old economic theory: The Bermuda Triangle of Economics is still in place: Slow growth, high unemployment and high stock market valuations kept in place by a policy where the 20% of the economy which is the listed companies and banks gets 95% of all credit and access to subsidies while the 80%, which creates 100% of all jobs, the SME’s [Small and Medium Enterprises] get less than 5% of credit and less than 1% of the political capital.
Markets and monetary policy
It’s the weather! The reason for the disappointing start to 2014 is all to do with the big cold in the US – well partly, I think most investors/pundits forgets that data coming in for December, January really was “born” 3,6, and 9 month before due to that specific times change in outlook, interest rates and the overall cycle. The slow-down in housing was “expected” in our models as I have constantly conveyed it to you through my economic co-op on econo-physics it has to do with spike in rates in mortgage rates between May and August 2013.
The US Consumer must have known the weather would be bad already last summer looking at this chart of Retails Sales:

The US consumer remains 2/3 of the economy but he is still conservative: Spending rose 2.0% in 2013 after 2.2% and 3.4% in 2012 and 2011. This is mainly due to low wage growth. Since 2010 the Average after tax income adjusted for inflation have only been 1.6%.
To reach the magic 3% growth we will need wages to grow 3% on their own! Not likely to happen in world of excess capacity, but never the less the pundits started the year with a 2.9% average expected growth for 2014. One month into the year, revisions came pouring in as Q1 is already reduced from 2.3% to 2.0%. The blockbuster Q4 growth of 3.2% is now expected to come in at 2.4% only!
One has to laugh at how imprecise these measures are – we watch them, take decisions on them but ultimately their reliability is really only valid six months past the first announcement. Talk about reverse engineering!
Strategy
Fixed income: Still see new lows in 2014 – mainly in Q4- into Q1-2015. ETF flow into fixed income has been +16 billion US Dollars year to date, could be largest inflow since 2002!
I mainly like US and Core Europe although Italy and BTP’s have done well with the power change from Letta to Renzi. The bet on rates down goes back all the way to last year.
[Expected] Dividend yield @ 1.89% vs. [current] 2.72% still attracts my money.
Equity: We have had a call for peak in Q1 – admittedly I did not expect 1840 to be broken, but my partner in Economo-physics still see chance of 1870/90 before top is in place.
I submit our updated November 2013 forecast which slightly corrected still stands – The risk reward is now wrong: Upside is 50 S&P points vs. 500 points down-side. Remember a 20/30% correction happens every 4-5 years – a 10% correction twice on average in ‘normal year’.

FX:
Overall the US Dollar should soon find support. The best long term gauge of the US dollar is World Growth minus US Growth. Why? Because US dollar is the reserve currency and often the currency of choice in trade. When the world growth is slowing (now…) then the US and the US Dollar needs to pull ahead to fill the gap. This is one of the catalysts we need to monitor over the next week or two as the US Dollar Index is right on its support line:

Conclusion:
The world economic flags is still almost in vacuum but some countries are now changing the position of the flag pole to get better wind conditions.
Safe travels,
Steen
Thanks Steen!
 Submitted by Tyler Durden on 02/26/2014 20:31 -0500

CRASH2: why it’s going to be a bloodbath on four fronts
 Blackrock was very bearish about the stock markets earlier this week. ‘Well I don’t know about Blackrock, but I’ve been counting signs since last October – and they all say The Top Is Coming’ was my response in yesterday’s Slogpiece about – among other things – idiots buying Greek shares “because they’re cheap”. As the week unfolds, opinion leaders are lining up to warn the greedy that it’s time to move out.
“A bull market is like sex. It feels best just before it ends,” Barton Biggs apparently said. Guru Joshua M. Brown says in his latest newsletter that ‘Facebook at 70, Tesla at 200, Netflix at 450, Google at 1200, it’s all of a piece’. And just as the saps think that if they don’t buy into ClubMed now they’ll be left behind, so the New Biggest Thing on Wall Street is that Old Dotcom Black Magic: buying into companies that have rarely if ever made a profit.
Jeff Mortimer of BNY Mellon Wealth Management has been pointing out this lunacy at Bloomberg:
‘Unprofitable companies such as Zynga Inc. and FireEye Inc. are leading gains in the Russell 1000 Index. The Nasdaq Biotechnology Index is up 25 percent in the past 10 weeks, the most since February 2012, data compiled by Bloomberg show. Less than a third of its 122 companies earned any money in the last 12 months. Marijuana shares, which trade on venues with less stringent reporting requirements, are among the most active.In this backdrop of human emotions, which begins to take over, it’s one of greed, it’s one of being willing to pay for something that will happen in the future, and being afraid that one might be left behind.’
But you see, in an investment Universe where everyone has at some point rubbished e = mc2, fear of not getting onto the bandwagon with the other lucky suckers vastly outweighs an analysis of the fundamentals. In the end, markets are just crowds. Crowds are rarely wise, especially when testosterone and coke are zapping from heart via brain to crotch.
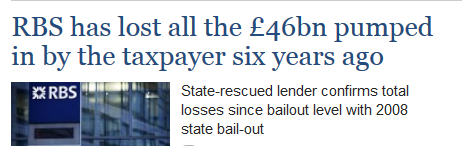
And don’t forget: it’s not just no profits yet bollocks out there. We have heard, over the last four years, an equal amount of bollocks from both Labour and Tory politicians about how one day we were all going to make a bundle out of RBS once Hannibal Heston had sorted it all out. Today’s Telegraph finance page offers a slight change in tone re this one:
 Ah well, that’s a bit more to add to the National Debt. But it isn’t holding the Great Fraudster back in his career: now boss at RSA, Hest the Pest is to bolster its capital by between £1.5-1.6bn over the next three years…using a £775m discounted rights issue and the cancellation of the final dividend for 2013 in order to do it.
What a star, eh? And he’s still at the jam tomorrow scam: “….the amount raised through a series of “self help” measures – including disposals, cost cutting and job cuts – could raise a similar amount over the next three years..” Er, yes Stephen, of course it might.
So the Fed tapers without actually tapering, and the emerging markets feel the pinch. But those clamouring to get into such markets are taking some hotheaded positions. The UK’s “real recovery” skitters about like a mirage on amphetamines, but the Ftse continues to climb. ClubMed shows not one solitary sign of fundamental, unmanipulated recovery….but because bond yields have been manipulated down, silly money piles in: and its bourses start to race ahead because “if it’s at the bottom, the only way is up”. Across the Pond, companies with potty business models, bonkers PE ratios, and no profit record to speak of heat up….and everyone wants to get on board. And ooh look, the worst is over, except that RBS just, um, lost all our money. Yes, all of it.
We are heading into a confluence of tits-up tributaries: these are gushing into the still waters of Golden Pond, at the end of which is the Bernanke Boulder Dam. When the dam bursts, nine years of jerry-built reinforcement will stand for nothing. This is going to be Crash2….a crash to make Crash1 look like a harmless skid by comparison.
Wednesday, February 26, 2014 2:45 AM
Saxo Bank's Steen Jakobsen Warns of Global Economic Vacuum, China Slowdown, Germany Growth Negative, 30% S&P Correction
Steen Jakobsen, chief economist at Saxo Bank in Denmark, sent an interesting email yesterday regarding China, Germany, the European debt crisis, and equity prices.
Steen is one of the speakers at Wine Country Conference II, May 1-2 in Sonoma, California.
What follows is from Steen, I dispense with my usual blockquote style for ease in reading.
Economic Vacuum
China’s flag is waving strongly these days, the direction of the economic- and political winds have changed but the present multitude of macro changes is yet to be recognized by consensus and the market.
My conclusion is this:
- China will slow-down to 5% growth over next two-three years.
- China will start devaluing their currency in response to Abenomics and weaker terms of trade
- China will no longer be the world’s biggest investor and importer of investment goods.
The changes will during 2014 mean that:
- Germany growth will go negative quarter-over-quarter in Q4 (from Q3)
- World growth will come down from the recent 3.7% to less than 3.0%
- The recovery will once again be postponed and the synchronic monetary policy of the major central banks will be questioned, leading to all time new lows in interest rates
- Deflation will take hold in Europe and become a major risk in the US
- This final third crisis in this cycle will mean equity needs to be sold off. This comes after commodities sold off in the US banking- and housing crisis, followed by fixed income during the late stage European debt crisis now I see a 30% correction in H2 of 2014 after a high is registered between 1840/1890 in the SPX.
I simply believe that China leads the world. They took the burden of world growth in their hands during the peak of the crisis in 2008/09 through the biggest fiscal expansion ever seen (550 billion US Dollars), then they increased their investment to GDP ratios securing export orders for major European and US exporters until late 2013, but since the Third Plenary Session of the 18th CPC Central Committee in November 2013 the main objectives for the political elite in China have changed from growth and export to rebalancing, fighting graft, reducing pollution and betting a small crisis now is better than a big one later.
I have already spent considerable amount of ink explaining why China is proactively seeking a small crisis rather than a big one and how China can no longer afford to keep its investment to GDP levels excessive but now China seems to have engaged in a fundamental change to its FX rates – attempting to weaken the CNY [Yuan].
China is a long term critic of Abenomics and the ensuing devaluations as Japan and Korea remains its key competitors in the export market, but until last week China held their FX tight and tightening but now things have changed:

Source: Bloomberg LLP & Saxo Bank
With the present geopolitical tension between China and Japan this chart is cause for concern for all of us: China no longer will play ‘nice’, they are this time ignoring “best practice” of playing paying lips service to the US-Sino relationship. Clearly Obama once again receiving the Dalai Lama in the White House is not helping the situation. That the rally in USD-CNY happened almost to the day Obama hosted the Dalai Lama is of course a pure coincidence! (They met Friday February 20th!)
China is not happy these days: The domestic economy needs rebalancing with the risk for upsetting the population and the bureaucrats. Overseas, Japan’s Abe is insisting on a stronger Japan, the US is clearly ignoring China advice on the Dala Lamai and overall the G-20 meeting had the developed world blaming the recent slow-down on the EM.
Not a good month for monetary coordination and friendly summits. The political crisis is biting ironically at a time where stock markets across the world is reaching 5, 7, and in the case of the UK 14 year highs! My old economic theory: The Bermuda Triangle of Economics is still in place: Slow growth, high unemployment and high stock market valuations kept in place by a policy where the 20% of the economy which is the listed companies and banks gets 95% of all credit and access to subsidies while the 80%, which creates 100% of all jobs, the SME’s [Small and Medium Enterprises] get less than 5% of credit and less than 1% of the political capital.
Markets and monetary policy
It’s the weather! The reason for the disappointing start to 2014 is all to do with the big cold in the US – well partly, I think most investors/pundits forgets that data coming in for December, January really was “born” 3,6, and 9 month before due to that specific times change in outlook, interest rates and the overall cycle. The slow-down in housing was “expected” in our models as I have constantly conveyed it to you through my economic co-op on econo-physics it has to do with spike in rates in mortgage rates between May and August 2013.
The US Consumer must have known the weather would be bad already last summer looking at this chart of Retails Sales:

The US consumer remains 2/3 of the economy but he is still conservative: Spending rose 2.0% in 2013 after 2.2% and 3.4% in 2012 and 2011. This is mainly due to low wage growth. Since 2010 the Average after tax income adjusted for inflation have only been 1.6%.
To reach the magic 3% growth we will need wages to grow 3% on their own! Not likely to happen in world of excess capacity, but never the less the pundits started the year with a 2.9% average expected growth for 2014. One month into the year, revisions came pouring in as Q1 is already reduced from 2.3% to 2.0%. The blockbuster Q4 growth of 3.2% is now expected to come in at 2.4% only!
One has to laugh at how imprecise these measures are – we watch them, take decisions on them but ultimately their reliability is really only valid six months past the first announcement. Talk about reverse engineering!
Strategy
Fixed income: Still see new lows in 2014 – mainly in Q4- into Q1-2015. ETF flow into fixed income has been +16 billion US Dollars year to date, could be largest inflow since 2002!
I mainly like US and Core Europe although Italy and BTP’s have done well with the power change from Letta to Renzi. The bet on rates down goes back all the way to last year.
[Expected] Dividend yield @ 1.89% vs. [current] 2.72% still attracts my money.
Equity: We have had a call for peak in Q1 – admittedly I did not expect 1840 to be broken, but my partner in Economo-physics still see chance of 1870/90 before top is in place.
I submit our updated November 2013 forecast which slightly corrected still stands – The risk reward is now wrong: Upside is 50 S&P points vs. 500 points down-side. Remember a 20/30% correction happens every 4-5 years – a 10% correction twice on average in ‘normal year’.

FX:
Overall the US Dollar should soon find support. The best long term gauge of the US dollar is World Growth minus US Growth. Why? Because US dollar is the reserve currency and often the currency of choice in trade. When the world growth is slowing (now…) then the US and the US Dollar needs to pull ahead to fill the gap. This is one of the catalysts we need to monitor over the next week or two as the US Dollar Index is right on its support line:

Conclusion:
The world economic flags is still almost in vacuum but some countries are now changing the position of the flag pole to get better wind conditions.
Safe travels,
Steen
Thanks Steen!
http://www.zerohedge.com/news/2014-02-26/morgan-stanley-warns-real-pain-if-chinese-currency-keeps-devaluing
Morgan Stanley Warns Of "Real Pain" If Chinese Currency Keeps Devaluing
- Carry Trade
- China
- Deutsche Bank
- Morgan Stanley
- Price Action
- Real estate
- Renminbi
- Shadow Banking
- Volatility
- Yuan
The seemingly incessant strengthening trend of the Chinese Yuan (much as with the seemingly inexorable rise of US equities or home prices) has encouragedhuge amounts of structured products to be created over the past few years enabling traders to position for more of the same in increasingly levered ways. That was all going great until the last few weeks which has seen China enter the currency wars (as we explained here). The problem, among many facing China, is that these structured products will face major losses and as Morgan Stanley warns "real pain will come if CNY stays above these levels," leading to further capital withdrawal, illiquidity, and a potential vicious circle as it appears thePBOC is trying to break the virtuous carry trade that has fueled so much of its bubble economy.
Deutsche Bank notes that Chinese equities yesterday hit 1 month lows and are 65% off the all time highs. There's a mix of reasons but one of the biggest stories of the past week or so has been the depreciation of the Chinese currency, both onshore where USDCNY is up 1.0% over the past week and offshore where USDCNH is up 1.25%.
Whilst these moves may not seem large in the context of other EM currencies, they are significant compared to the usual size of Renminbi moves.
As we noted here, Deutsche adds that whilst there has been some weak Chinese data which might explain part of the depreciation, the broad feeling is that this move has been driven by efforts by the PBOC to shakeout the large long Renminbi carry trade that has been built on the back of the view that the Chinese currency can only appreciate in value.
Indeed worries at the PBOC may have been triggered by one sign of this carry trade in action – the premium with which offshore USDCNH has been trading over the tightly controlled onshore USDCNY value over the course of 2014. This premium has now largely disappeared.

The total size of the carry trade is hard to estimate although even just looking at some of the onshore CNY positions accumulated, DB Asia FX strategist Perry Kojodjojo estimates that corporate USD/CNY short positions are around $500bn. The size of the carry trade and the fact that China saw significant capital outflows during the last period of substantial Renminbi depreciation in the summer of 2012 has led to concerns over what this might mean for both the Chinese economy and financial markets as well as broader global financial implications.
Morgan Stanley believes thatone such carry-trade structured product that will be the "pressure point" for this - should the Yuan continue to depreciate - is the Target Redemption Forward (TRF) which has a payoff that looks as follows...While this is just an example of a product payoff matrix to the holder, the broader point is that the USD/CNH market has a particular level (or range of potential levels) at which three factors can create non-linear price action. These are:1. Losses on TRF products will (on average) crystallize if USD/CNH goes above a certain level. This has implications for holders of TRF products, who are mostly corporates;2. The hedging needs of writers of TRF products (banks) mean that there is a point of maximum vega for banks in USD/CNH. Below this level banks need to sell USD/CNH vol; above this level banks need to buy USD/CNH vol;3. The delta-hedging needs of banks are complex. As we approach the average strike (the 6.15 in the theoretical point of Exhibit 1), banks need to buy spot USD/CNH. Above this point but below the European Knock-in (EKI) (i.e., between 6.15 and 6.20 in Exhibit 1), banks need to sell spot. Then above the EKI, banks don’t need to do anything in spot.From internal Morgan Stanley data, we estimate that the point of maximum vega is somewhere in the range of 6.15-6.20, and that the 6.15-6.20 in Exhibit 1 is reasonably indicative of the average strikes and EKIs in the market.In other words, so long as the TRF products remain in place (i.e., are not closed out) and we remain below the maximum vega point (somewhere between 6.15 and 6.20), there is natural selling pressure by banks in USD/CNH vol. When we get above that level, there is natural vol buying pressure.Of course, in the scenario that USD/CNH keeps trading higher and goes above the average EKI level, the removal of spot selling flow by banks and the need to buy vol means the topside move may accelerate.


Simply put, if the CNY keeps going (whether by PBOC hand or a break of the virtuous cycle above), then things get ugly fast...
How Much Is at Stake?
In their previous note, MS estimated that US$350 billion of TRF have been sold since the beginning of 2013. When we dig deeper, we think it is reasonable to assume that most of what was sold in 2013 has been knocked out (at the lower knock-outs), given the price action seen in 2013.
In their previous note, MS estimated that US$350 billion of TRF have been sold since the beginning of 2013. When we dig deeper, we think it is reasonable to assume that most of what was sold in 2013 has been knocked out (at the lower knock-outs), given the price action seen in 2013.
Given that, and given what business we’ve done in 2014 calendar year to date, we think a reasonable estimate is that US$150 billion of product remains.Taking that as a base case, we can then estimate the size of potential losses to holders of these products if USD/CNH keeps trading higher.In round numbers, we estimate that for every 0.1 move in USD/CNH above the average EKI (which we have assumed here is 6.20), corporates will lose US$200 million a month. The real pain comes if USD/CNH stays above this level, as these losses will accrue every month until the contract expires.Given contracts are 24 months in tenor, this implies around US$4.8 billion in total losses for every 0.1 above the average EKI.

Deutsche Bank concludes...
Looking forward it’s possible that the PBOC is not attempting to actively engineer a sustained depreciation of the Renminbi but rather is attempting to increase the level of two-way volatility in the market to discourage the carry trade and also excessive capital inflows. In terms of the broad risk going forward the sheer scale of the challenge the PBOC has set out to tackle likely means they will have to move with restraint. This is certainly a story to watch...
As Morgan Stanley warns however, this has much broader implications for China...
The potential for US$4.8 billion in losses for every 0.1 above the average EKI could have significant implications for corporate China in its own right, as could the need to post collateral on positions even if the EKI level is not breached.However, the real concern for corporate China is linked to broader credit issues. On that, it’s worth reiterating that the corporate sector in China is the most leveraged in the world. Further loss due to structured products would add further stress to corporates and potentially some of those might get funding from the shadow banking sector. Investment loss would weaken their balance sheets further and increase repayment risk of their debt.In this regard, it wouldpotentially cause investors to become more concerned about trust products if any of these corporates get involved in borrowing through trust products. In this regard, this would raise concerns among investors, given that there is already significant risk of credit defaults to happen in 2014.
Remember, as we noted previously, these potential losses are pure levered derivative losses... not some "well we are losing so let's greatly rotate this bet to US equities" which means it has a real tightening impact on both collateral and liquidity around the world... yet again, as we noted previously, it appears the PBOC is trying to break the world's most profitable and easy carry trade - which has created a massive real estate bubble in their nation (and that will have consequences).
+++++++++++++++
The bottom line is the question of whether the PBOC's engineering this CNY weakness is merely a strategy to increase volatility and thus deter carry-trade malevolence (in line with reform policies to tamp down bubbles) OR is it a more aggressive entry into the currency wars as China focuses on its trade (exports) and keeping the dream alive? (Or, one more thing, the former morphs into the latter as a vicious unwind ensues OR the market tests the PBOC's willingness to break their momentum spirit).
It appears, as Bloomberg notes, the PBOC is winning:
Yuan has gone from being most attractive carry trade bet in EM to worst in 2 mos as central bank efforts to weaken currency cause volatility to surge.Yuan’s Sharpe ratio turned negative this yr as 3-mo. implied volatility in currency rose in Feb. by most since May, when Fed signaled plans to cut stimulus
http://www.zerohedge.com/news/2014-02-27/draghis-monetary-nightmare-refuses-end-european-private-lending-remains-stuck-record

Submitted by Tyler Durden on 02/27/2014 08:24 -0500


Draghi's Monetary Nightmare Refuses To End As European Private Lending Remains Stuck At Record Low Levels
With just released inflation figures out of Germany coming weaker than expected, Mario Draghi's monetary nightmare - how to spur credit creation in Europe to the private sector - just got even worse. Incidentally the topic of Draghi's "Monetary Nightmare" is well-known to regular readers and has been covered here extensively in the past, most recently here. So while we await to see how the ongoing deflation in Europe, soon hitting its core too, spreads through the system, the most recent data out of Europe is that lending to non-financial corporations declined once again in January, this time by €11.7billion, adjusted for securitizations and sales. On an annual basis, the decline in January was -2.0%, the same as December, and worse than the -1.8% in November as reported by the ECB.
The long-term chart is an absolute disaster.

Here is what SocGen has to say about it:
Money supply growth (M3) in the euro accelerated in January, from 1.0% to 1.2% yoy, still well below the ECB’s 4.5% reference target. The flow of credit to the private sector seems to have troughed, as it dropped by 2.0% yoy (adjusted for securitization and sales), unchanged from December. The release of today’s figures is not likely to affect the outcome of the March 6 ECB meeting, at which we do not expect fresh action. In fact, the latest soft and hard data published suggest that the ECB’s scenario of a gradual recovery (1.1% GDP growth in 2014) is taking shape.The flow of credit to the private sector (adjusted for securitization and sales) stopped decreasing in January, after a cumulative €45bn fall during the previous two months. The growth rate stood at -2.0% yoy, unchanged from December. Although credit flows seem to have reached a bottom, it is hard to distinguish a material improvement here.
Indeed it is, and it also means that Draghi continues to be in a no way out, since credit destruction is not bad enough to prompt much more easing, or certainly QE, and is not nearly good enough to stimulate any economic growth except net of GDP definition revisions.
Here is the breakdown by country on a three year basis:

And the Y/Y change in outstanding levels:
No comments:
Post a Comment