Have a banana...... after all , we do live an a banana republic
Twirmoil Strikes; Treasury Yields Surge To 29-Month Highs As EURUSD Insanity Ensues

TWTR collapsed ~15% off its highs (losing 1 BBRY or 2 JCPs) and FB tumbled 4%. Stocks overall broke their winning streak with a modestly red close but it was the action in the bond, commodity, and FX markets that stood out. Following copper's flash smash Tuesday, gold and even more so silver held their gains from the surge yesterday and pressed higher still today (silver's best week in 4 months). WTI crude closed at 2-month highs above $100. A massive range day in the USD driven by a EUR surge to test 1.39 (2-year high and fail) swung the world's reserve currency down 1% and back up 1% (in a mini-Bitcoin-like panic). Yield rose modestly on the day with 10Y crossing 3% early on, pulling back, then hovering there into the close for the highest close in 2.5 years. VIX was a one-way stret higher all day. All in all - a glance at these charts will make you wonder WTF...
Twirmoil!!

TWTR offers a big dip to buy... or is it over?

Stocks overall trod water today after a breathless rally in the last few days...after the2nd best 7-day run in 15 months

VIX continued to disconnect as hedges were locked in...

and Credit diverged once again (tracking VIX!)...

Treasuries rose 9-11bps on the week...

with 10Y closing above 3% for the first time since July 2011...

Commodities were a mess this week... just look at this idiocy - this was Silver's best week in over 4 months!

And look at the vol in FX today!!!

EURUSD is supposedly the most liquid FX pair in the world... it roundtripped over 1% today - and people laugh at Bitcoin...
Behold - The Circus Tent Formation...

Charts: Bloomberg
Bonus Chart: Think US stocks did well this year, ythink again... we give you Venezuelan equities - coming to a US exchange near you soon...

Bonus Bonus Chart: What happened the last time Treasury yields were this rich relative to stock dividend yields?

Today The Fed Soaked Up A Record $95 Billion In Excess Liquidity Sloshing Around
Once upon a time, back in 2010 and 2011, the Fed's Primary Dealers would engage in a furious game of window dressing at the end of every quarter, when they would sell their risky assets, and convert them into cash, a phenomenon which could be followed on the Fed's Primary Dealer asset holding page, and which we would showcase periodically such as on the chart below from October 2011.

Well, in the intervening period, when the Fed managed to soak up another $1.3 trillion in "high quality collateral", and replace it with fungible reserves (used exclusively as collateral for marginable risk-on positions) courtesy of QEternity, something changed. Whether it is a regulatory matter, or simply liquidity preference, but holding Treasury paper has become more attractive to US financial firms (mostly Primary Dealers) than holding cash.
Enter the Fed's recently announced (read more here) Fixed-Rate Reverse Repo facility, which earlier today saw its greatest use to date in history, when a record $95 billion in Treasury paper was repoed out to the street for a 3 day term, at an 0.03% annual rate. Since there were 68 bidders in the operation, the average participant had an extra $1.4 billion in cash lying around to give to the Fed in exchange for holding Treasurys into year end.

So for all those wondering about all those sophisticated technical and fundamental reasons why the Fed is pushing hard on the Reverse Repo pedal, and how this is indicative of the Fed's far-sighted approach of how to best executed a tightening when the time comes, turns out the FRRR facility was nothing more than yet another way that the Fed allows banks to paint their books for t month, quarter and year end purposes.
But while the Fed enabling its real owners is nothing new, what is perhaps more troubling is that earlier today there was $95 billion in excess liquidity floating around. With a B.
So yes, keep repeating that there is no liquidity bubble.
Excess liquidity sloshing around leads to this......
Guest Post: The Stock Market Has Officially Entered Crazytown Territory
- Guest Post
- Housing Bubble
- Housing Prices
- McDonalds
- National Debt
- New York Stock Exchange
- Obamacare
- recovery
Submitted by Michael Snyder of The Economic Collapse blog,
It is time to crank up the Looney Tunes theme song because Wall Street has officially entered crazytown territory. Stocks just keep going higher and higher, and at this point what is happening in the stock market does not bear any resemblance to what is going on in the overall economy whatsoever. So how long can this irrational state of affairs possibly continue? Stocks seem to go up no matter what happens. If there is good news, stocks go up. If there is bad news, stocks go up. If there is no news, stocks go up. On Thursday, the day after Christmas, the Dow was up another 122 points to another new all-time record high. In fact, the Dow has had an astonishing 50 record high closes this year. This reminds me of the kind of euphoria that we witnessed during the peak of the housing bubble. At the time, housing prices just kept going higher and higher and everyone rushed to buy before they were "priced out of the market". But we all know how that ended, and this stock market bubble is headed for a similar ending.
It is almost as if Wall Street has not learned any lessons from the last two major stock market crashes at all. Just look at Twitter. At the current price, Twitter is supposedly worth 40.7BILLION dollars. But Twitter is not profitable. It is a seven-year-old company that has never made a single dollar of profit.
Not one single dollar.
In fact, Twitter actually lost 64.6 million dollarslast quarter alone. And Twitter is expected to continue losing money for all of 2015 as well.
But Twitter stock is up 82 percent over the last 30 days, and nobody can really give a rational reason for why this is happening.
Overall, the Dow is up more than 25 percent so far this year. Unless something really weird happens over the next few days, it will be the best year for the Dow since 1996.
It has been a wonderful run for Wall Street. Unfortunately, there are a whole host of signsthat we have entered very dangerous territory.
The median price-to-earnings ratio on the S&P 500 has reached an all-time record high, and margin debt at the New York Stock Exchange has reached a level that we have never seen before. In other words, stocks are massively overpriced and people have been borrowing huge amounts of money to buy stocks. These are behaviors that we also saw just before the last two stock market bubbles burst.
And of course the most troubling sign is that even as the stock market soars to unprecedented heights, the state of the overall U.S. economy is actually getting worse...
-During the last full week before Christmas, U.S. store visits were 21 percent lower than a year earlier and retail sales were 3.1 percentlower than a year earlier.
-The number of mortgage applications just hita new 13 year low.
-The yield on 10 year U.S. Treasuries just hit 3 percent.
For many more signs like this, please see my previous article entitled "37 Reasons Why 'The Economic Recovery Of 2013' Is A Giant Lie".
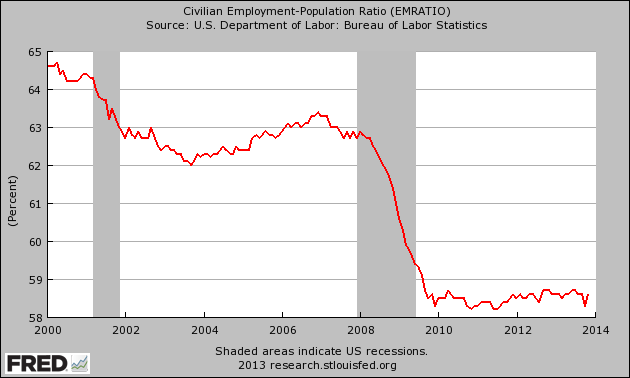
And most Americans don't realize this, but the U.S. financial system and the overall U.S. economy are now in much weaker condition than they were the last time we had a major financial crash back in 2008. Employment is ata much lower level than it was back then and our banking system is much more vulnerablethan it was back then. Just before the last financial crash, the U.S. national debt was sitting at about 10 trillion dollars, but today it has risen to more than 17.2 trillion dollars. The following excerpt from a recent article postedon thedailycrux.com contains even more facts and figures which show how our "balance sheet numbers" continue to get even worse...
Since the fourth quarter of 2009, the U.S. current account deficit has been more than $100 billion per quarter. As a result, foreigners now own $4.2 trillion more U.S. investment assets than we own abroad. That's $1.7 trillion more than when Buffett first warned about this huge problem in 2003. Said another way, the problem is 68% bigger now.And here's a number no one else will tell you – not even Buffett. Foreigners now own $25 trillion in U.S. assets. And yet… we continue to consume far more than we produce, and we borrow massively to finance our deficits.Since 2007, the total government debt in the U.S. (federal, state, and local) has doubled from around $10 trillion to $20 trillion.Meanwhile, the size of Fannie and Freddie's mortgage book declined slightly since 2007, falling from $4.9 trillion to $4.6 trillion. That's some good news, right?Nope. The excesses just moved to a new agency. The "other" federal mortgage bank, the Federal Housing Administration, now is originating 20% of all mortgages in the U.S., up from less than 5% in 2007.Student debt, also spurred on by government guarantees, has also boomed, doubling since 2007 to more than $1 trillion. Altogether, total debt in our economy has grown from around $50 trillion to more than $60 trillion since 2007.
So don't be fooled by this irrational stock market bubble.
Just because a bunch of half-crazed investors are going into massive amounts of debt in a desperate attempt to make a quick buck does not mean that the overall economy is in good shape.
In fact, much of the country is in such rough shape that "reverse shopping" has become a huge trend. Even big corporations such as McDonald's are urging their employees to return their Christmas gifts in order to bring in some much needed money...
In a stark reminder of how tough things still are for low-income families in America, McDonalds has advised workers to dig themselves "out of holiday debt" by cashing in their Christmas haul."You may want to consider returning some of your unopened purchases that may not seem as appealing as they did," said a website set up for employees."Selling some of your unwanted possessions on eBay or Craigslist could bring in some quick cash."
This irrational stock market bubble is not going to last for too much longer. And a lot of top financial experts are now warning their clients to prepare for the worst. For example, David John Marotta of Marotta Wealth Management recently told his clients that they should all have a "bug-out bag" that contains food, a gun and some ammunition...
A top financial advisor, worried thatObamacare, the NSA spying scandaland spiraling national debt is increasing the chances for a fiscal and social disaster, is recommending that Americans prepare a “bug-out bag” that includes food, a gun and ammo to help them stay alive.David John Marotta, a Wall Street expert and financial advisor andForbes contributor, said in a note to investors, “Firearms are the last item on the list, but they are on the list. There are some terrible people in this world. And you are safer when your trusted neighbors have firearms.”His memo is part of a series addressing the potential for a “financial apocalypse.” His view, however, is that the problems plaguing the country won't result in armageddon. “There is the possibility of a precipitous decline, although a long and drawn out malaise is much more likely,” said the Charlottesville, Va.-based president of Marotta Wealth Management.
So what do you think is coming in 2014?
The Probability Of A Stock Market Crash Is Soaring
- Ben Bernanke
- Equity Markets
- Federal Reserve
- Gross Domestic Product
- John Hussman
- Market Crash
- New York Stock Exchange
- Quantitative Easing
- Volatility
While some individual stocks (cough TWTR cough) may have reached irrational bubble territory, the US equity market is undergoing a seemingly 'rational' bubble. However, as John Hussman illustrates in the following chart, the probability of a stock market crash is growing extremely rapidly.

Based on the this paper, Hussman simplifies the rational bubble as:
You only hold one long one more period if expected return is positive - requiring EXTRAGAIN x (1-p) + CRASHLOSS x (p) to be greater than 0.
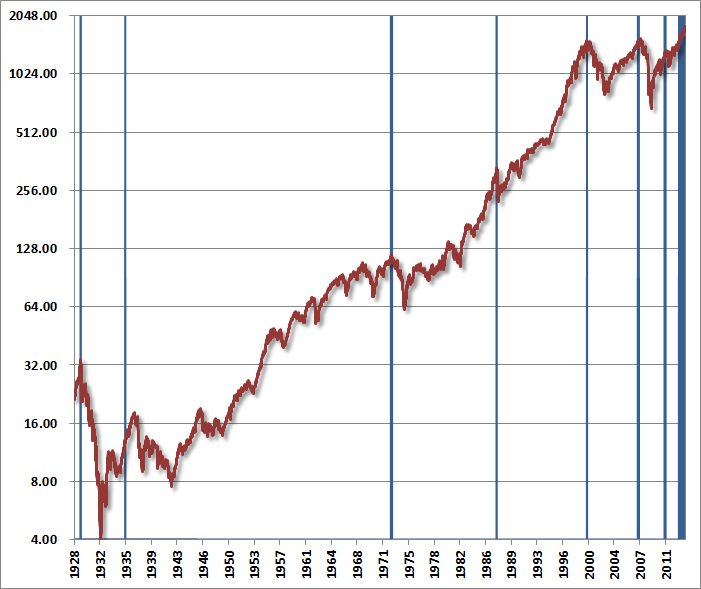
Regardless of last week’s slight tapering of the Federal Reserve’s policy of quantitative easing,speculators appear intent on completing the same bubble pattern that has attended a score of previous financial bubbles in equity markets, commodities, and other assets throughout history and across the globe.
The chart below provides some indication of our broader concerns here. The blue lines indicate the points of similarly overvalued, overbought, overbullish, rising-yield conditions across history (specific definitions and variants of this syndrome can be found in numerous prior weekly comments). Sentiment figures prior to the 1960’s are imputed based on the relationship between sentiment and the extent and volatility of prior market fluctuations, which largely drive that data. Most of the prior instances of this syndrome were not as extreme as at present (for example, valuations are now about 35% above the overvaluation threshold for other instances, overbought conditions are more extended here, and with 58% bulls and only 14% bears, current sentiment is also far more extreme than necessary). So we can certainly tighten up the criteria to exclude some of these instances, but it’s fair to say that present conditions are among the most extreme on record.
This chart also provides some indication of our more recent frustration, as even this variant of “overvalued, overbought, overbullish, rising-yield” conditions emerged as early as February of this year and has appeared several times in the past year without event. My view remains that this does not likely reflect a permanent change in market dynamics – only a temporary deferral of what we can expect to be quite negative consequences for the market over the completion of this cycle.
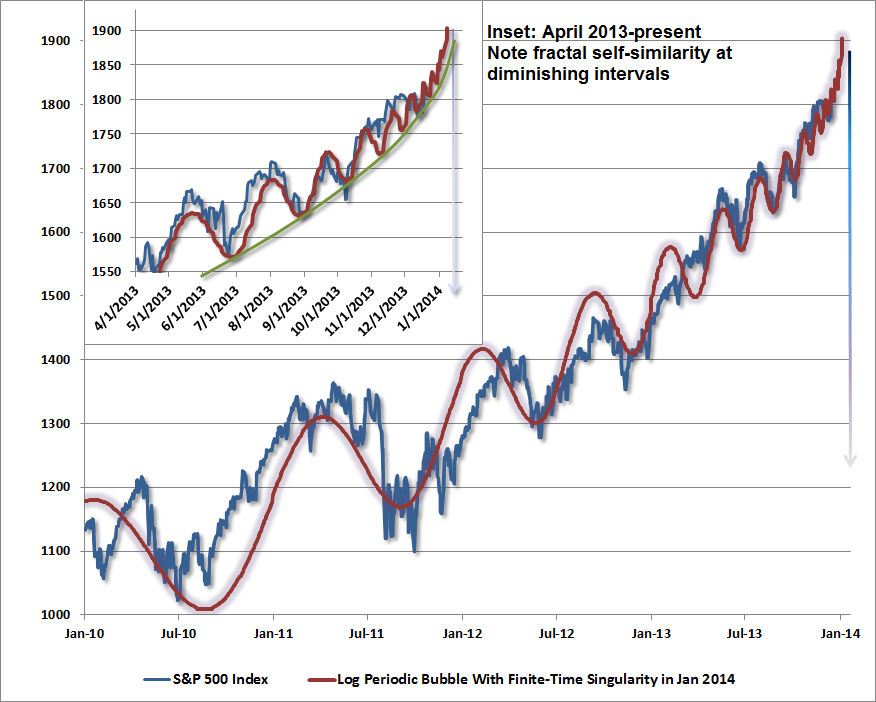
Narrowing our focus to the present advance, what concerns us isn’t simply the parabolic advance featuring increasingly immediate impulses to buy every dip – which is how we characterize the psychology behind log-periodic bubbles (described by Didier Sornette in Why Markets Crash). It’s that this parabola is attended by so many additional and historically regular hallmarks of late-phase speculative advances. Aside from strenuously overvalued, overbought, overbullish, rising-yield conditions, speculators are using record amounts of borrowed money to speculate in equities, with NYSE margin debt now close to 2.5% of GDP. This is a level seen only twice in history, briefly at the 2000 and 2007 market peaks. Margin debt is now at an amount equal to 26% of all commercial and industrial loans in the U.S. banking system. Meanwhile, we are again hearing chatter that the Federal Reserve has placed a “put option” or a “floor” under the stock market. As I observed at the 2007 peak, before the market plunged 55%, “Speculators hoping for a ‘Bernanke put’ to save their assets are likely to discover – too late – that the strike price is way out of the money.”
The following chart is not a forecast, and certainly not something to be relied upon. It does, however, provide an indication of how Sornette-type bubbles have ended in numerous speculative episodes in history, in equities, commodities, and other assets, both in the U.S. and abroad. We are already well within the window of a “finite-time singularity” – the endpoint of such a bubble, but it is a feature of parabolas that small changes in the endpoint can significantly change the final value. The full litany of present conditions could almost be drawn from a textbook of pre-crash speculative advances. We observe the lowest bearish sentiment in over a quarter century, speculation in equities using record levels of margin debt, depressed mutual fund cash levels, heavy initial public offerings of stock, record issuance of low-grade “covenant lite” debt, strikingly rich valuations on a wide range of measures that closely correlate with subsequent market returns, faith that the Fed has put a “floor” under the market (oddly the same faith that investors relied on in 2007), and the proliferation of “this time is different” adjustments to historically reliable investment measures.
Even at 1818 on the S&P 500, we have to allow for the possibility that speculators have not entirely had their fill. In my view, the proper response is to maintain a historically-informed discipline, but with limited concessions (very small call option positions have a useful contingent profile) to at least reduce the temptation to capitulate out of undisciplined, price-driven frustration. Regardless of whether the market maintains its fidelity to a “log-periodic bubble,” we’ll continue to align our position with the expected return/risk profile as it shifts over time. That said, the “increasingly immediate impulses to buy every dip” that characterize market bubbles have now become so urgent that we have to allow for these waves to compress to a near-vertical finale.
The present log-periodic bubble suggests that this speculative frenzy may very well have less than 5% to run between current levels and the third market collapse in just over a decade.
As I advised in 2008 just before the market collapsed, be very alert to increasing volatility at 10-minute intervals.
Evening Fred,
ReplyDeleteThat was a lot of updates, especially amazed about Japan's record food exports. Found the Syrian updates very informative, I didn't realize there were 2 Kurdish factions.
And I say bring on the market collapse, I'm as ready as I ever will be.
Morning Kev ! There ha been quite a lot going on ! Interesting news on the BitCoin front , Turkey seems to be boiling again , Fukushima is quite the mess , Japan - China seems ready for another round of posturing and hostilities thanks to PM Abe's visit to the War Shrine...... And to your point , amazing Japan could have record exports of food considering what seems to be the situation with contamination of radiation ( impacting foods grown on land or from the Pacific ! ) Kurd situation fascinating - even in Iraq , there were always two major kurdish parties ( I guess there just a simple " kurdish " point of view ?) Perhaps even within their particular religious sect , they allow more democratic expression of points of view than other groups in the region.
DeleteA marker collapse is primed , folks can't say they weren't warned beforehand and afterwards it will seem so very obvious ! When the PTBs want to pull the stock market , they will. With HFTs , it can be done at will.