NASDAQ / Tech stock bubble harbingers .....
http://www.theverge.com/2013/10/18/4853682/ahead-of-twitter-ipo-nyse-will-allow-dry-run-of-trading-systems


 Submitted by Tyler Durden on 10/20/2013 11:48 -0400
Submitted by Tyler Durden on 10/19/2013 10:24 -0400


http://www.theverge.com/2013/10/18/4853682/ahead-of-twitter-ipo-nyse-will-allow-dry-run-of-trading-systems
Ahead of Twitter IPO, NYSE will allow dry run of trading systems to avoid glitches
Ahead of Twitter's IPO, the New York Stock Exchange is taking extra precautions to avoid the glitches Nasdaq suffered when Facebook went public. Facebook's debut on Wall Street in May was hampered by delays and order failures on the Nasdaq, which ultimately resulted in the exchange agreeing to pay a record-setting $10 million fine to the Securities and Exchange Commission. The troubles contributed to the social network's stock price getting off to an unimpressive start, one that took months to fully rebound from. As Twitter, yet another massively popular brand, prepares for its IPO, NYSE officials are hoping to eliminate any potential headaches. Trading firms will be permitted to conduct a dry run of their systems in preparation for Twitter's big day. This one-time test has been scheduled for October 26th; Twitter's IPO is expected to come sometime in November. Trading outages have led Nasdaq and the NYSE to consider sharing data in hopes of eliminating future incidents.
http://www.theverge.com/2013/10/18/4853664/how-googles-record-stock-high-compares-to-other-tech-giants
How Google's record stock high compares to other tech giants
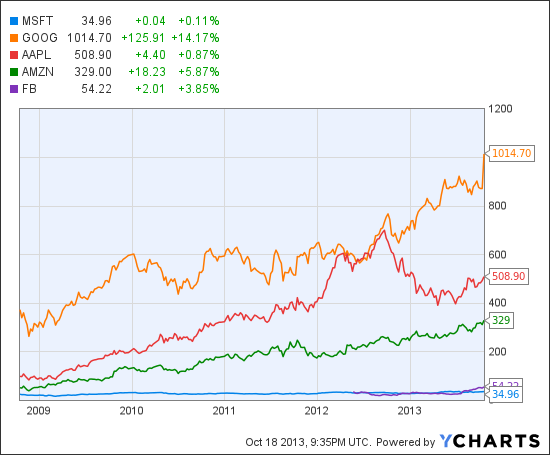
Google's stock price broke $1,000 for the first time today, as investors continue to be impressed by the company's steady growth in search advertising. The 13 percent stock surge, which came a day after a stronger-than-expected earnings report from the company, doesn't make Google the most valuable tech company. That honor currently belongs to Apple, which has a market capitalization of $462.3 billion, compared to $338 billion for Google.
MSFT Market Cap data by YCharts
Still, Google's stock performance has been quite impressive over the past year, as the chart below shows. Stock price is only one measure of a company's success — Apple has been historically undervalued relative to its profits, and critics say Amazon is overvalued given its lack of them — but it is a good measure of investors' expectations of a company's potential in the near future. When it comes to Google, investors' expectations are big and getting bigger.
http://www.zerohedge.com/news/2013-10-20/free-volling-vix-plunges-someone-bets-67-million-prompt-rebound
Free Volling: As VIX Plunges, Someone Bets $6.7 Million On Prompt Rebound
While last week's relentless panic buying has been extensively commented on, it was last week's nearly 50% plunge in near-term stock vol that the major news as the world went fromrisk off mode to risk on. It wasn't just stocks whose volatility imploded: as the following charts from Bank of America and associated commentary show, it was the implied near-term volatility of all asset classes that was hammered in the past three days.
First equities:
 Chart of the week: VXV/VIX ratio says risk rally to continueWhile the VIX index has just reached fresh 2m lows, it still has plenty of room to fall; particularly against its curve. Indeed, the VXV/VIX ratio (VXV is the Bloomberg ticker for 3m S&P500 Volatility) continues to trend higher. Until this ratio reaches 1.2 or greater (indicating investor complacency) the US equity rally remains on firm footing.

But also Treasurys:
US Fixed Income volatility breakdownThe MOVE index has broken its yearlong pivot at 73.00 and completed a 3m top in the process. Expect Treasury volatility to decline further in the weeks ahead towards the May lows at 48.87 before greater signs of basing emerge.

FX...
 FX volatility descent acceleratesG7 FX volatility remains under pressure. The mid-September completion of a 7m Head and Shoulders Top says that the fall in volatility can extend to the Dec’12 lows at 7.06% before all is said and done.

And Crude:
 Oil volatility spills lowerAfter 6m of a very choppy consolidation, WTI Crude Oil volatility has broken sharply lower to resume its year and a half downtrend. The completed Triangle formation points to further downside in the weeks ahead. The initial target is the Mar-28 low at 17.60, with risk for a move to its long term channel base near 13.53.

Finally, while everyone is fascinated by the rapid VIX down move, it is what someone did on Friday by betting that VIX will double by February in a 24/29 VIX Call Spread, that was of note. The amount wagered: $6.7 million. Whether or not this was an outright trade, or a hedge (and if one listens to Jamie Dimon perjuring himself to Congress, any trade is a hedges, adding further to the confusion) is unknown, but it is not pocket change betting that the plunge in vol will be merely transitory.From Bloomberg:
An investor paid $6.7 million for a trade that will pay off if the Chicago Board Options Exchange Volatility Index more than doubles by February.The trader today bought 160,000 bullish contracts on the VIX expiring in February with a strike price of 24, while selling the same number of February 29 calls in a strategy known as a call spread, according to New York-based Trade Alert LLC. The trade profits if the volatility gauge rises above 24.42 from the current level around 13, data compiled by Bloomberg show. It has a maximum payoff if the VIX jumps 115 percent to 29.“This is probably an investor with a portfolio of stocks who is using the VIX to hedge against an increase in market volatility,” Frederic Ruffy, a Chicago-based senior options strategist at Trade Alert, said in a phone interview. “The focus is on the February options, so it expresses concern over what will happen during the next three months, which coincides with the next deadlines on the government budget.”Congress resolved a deadlock on funding the U.S. government and avoiding a default this week, driving the VIX down from a three-month high of 20.34 on Oct. 8. The agreement funds the federal government through mid-January and lifts the nation’s debt ceiling until Feb. 7.The VIX, which hasn’t closed above 29 since the end of 2011, slumped 3.3 percent to 13.04 today, a one-month low.The purchased February 24 calls cost 90 cents per contract, while the February 29 calls were sold at 48 cents. The total cost of the trade was 42 cents per contract, or $6.7 million, according to data compiled by Bloomberg.
So with the latest can-kicking set to expire in less than three months, and at least one investor already putting in millions in a wager that Vol, currently plunging, will once again double as the Congressional dysfunction returns, one wonders: Will Mr. Chairman, who runs the world's biggest hedge fund, get to work as usual, and make sure any and all risk hedges expire worthless, as the New Normal continues to be defined by Return, and zero Risk?
http://www.zerohedge.com/news/2013-10-19/goldman-entire-sp-move-higher-due-multiple-expansion-shiller-pe-says-30-overvalued-s
Goldman: Entire S&P Move Higher Is Due To Multiple Expansion; Shiller P/E Says 30% Overvalued So... Buy
While it has been a stretch to call Bernanke's post-2009 experiment in "wealth-effect" central planning (where in 2013 the Russell 2000 has outperformed the composite hedge fund by a factor of over 500%!) a "market", here are some of the latest market thoughts by Goldman's David Kostin.
US stocks surged to an all-time high of 1745 following the debt accord. The S&P 500 has returned 22% YTD driven almost entirely by P/E multiple expansion rather than higher earnings.
In other words, there has been zero actual bottom line improvement in 2013. Zilch. Nada. All this despite so many loud promises by every pundit in late 2012 that 2013 will be the year of the turn, just wait, you'll see. It also means there has been zero "fundamental" component to the upside. All of it is multiple expansion. What's another name for that? Why, "the Fed."
Bearishly inclined investors will point to the cyclically-adjusted P/E ratio popularized by newly-crowned Nobel laureate Robert Shiller that suggests the S&P 500 is roughly 30% overvalued based on 10-year trailing average reported EPS.
"30% overvalued" by a person who just won the Nobel prize for saying the market is irrational and creates bubbles? You don't say. Why is a perfect segue into the final Goldman notice:
We forecast the index will climb to 1750 by year-end 2013, a slim advance less than 1% above today’s level. Our year-end 2014 price target remains 1900 or 9% above the current level. S&P 500 trades at 2.6x price/book value. From a valuation perspective, the index level is consistent with the market’s current return on equity (ROE) of 15.5%, and in-line with the 35-year average P/B.
To summarize Goldman:
- All upside is multiple expansion-driven, i.e. relentless Fed pumping of risks as the final bubble grows to unprecedented proportions,
- A market which even tenured economists say is a disaster waiting to happen.
- But hey, the music is still playing so everyone must dance all the way until Goldman's 2100 target... in 2015.
All of this has come and gone before, but since this time will be different, one can just ignore the recurring past.
And, finally, some charts:


http://www.forbes.com/sites/timworstall/2013/10/19/googles-at-1000-because-of-a-wall-street-fetish/?partner=yahootix
Or perhaps this should be phrased the other way around, Google's GOOG +13.8%stock is now at $1,000 a piece or so because Wall Street has rather gotten over an old fetish that is used to have. This isn’t anything at all to do with the value of Google as a company, nor the total value of its outstanding stock. That is determined by the net present value of expected future profits from the company, not by some so odd as a folk belief or fetish. No, I’m talking rather about that $1,000 number and why people don’t do stock splits like they used to:
With its surge on Friday, Google Inc became the latest member, though not likely the last, of a tiny fraternity of companies that boast $1,000 share prices.In a market where stock splits have become rarer, there may be more of this to come than just the two stocks with four-digit stock prices in the Standard & Poor’s 500 index – Google and Priceline.com PCLN +1.67%, which hit $1,000 earlier this year.Historically, once share prices got too high – even around $125 a share – companies split shares to make them more accessible to Main Street investors. But splits have become few and far between, and big numbers are more the norm for familiar names like Apple AAPL +0.87% Inc, Chipotle Mexican Grill CMG +16.1% Inc, Netflix NFLX +1.02% Inc and Visa V +1.09% Inc.
This is true: companies used to split their stock when prices got to that $125 level or so. For the folk belief was, the fetish if you like, that investors “liked” stocks that were in the $10 to $100 range. If a stock price went considerably above that range then it would split, say a two for one at $140, leaving the investor with two shares at $70 each instead of one at $140. Similarly, if a stock dipped below $10 it might well do a stock consolidation, taking in two shares at $7 each to leave the investor with one new one at $14.
There’s no particular reason this should work in any manner, it’s only a change in the nominal value, the total value of any shareholding would be the same at the end. The same percentage of the same company and presumably the same dollar value. Except that itwasn’t the same dollar value at the end of it all. Despite there being no particular reason this should be true that two shares at $70 would end up being worth $72 each (purely an example plucked from the air you understand) that $14 consolidated stock would be $15.
Given that there was in fact no reason why this should be true it ends up that it was true only because lots of people believed that investors liked stocks in the $10 to $100 range. Thus if a company did a split/consolidation everyone placed a higher value on the stock because they thought everyone else would do so.
There’s something of a holdover in this in that a stock will be delisted from Nasdaq if it consistently trades below $1 a share. A consolidation must take place, one that makes no difference at all to the total value of the company (except, of course, that it gets to stay on Nasdaq), but one which gets that nominal stock price back over $1 a share.
Now we might say that because it’s true therefore there must be some underlying reason other than just that everyone believed it. But over The Pond on the London market (the London Stock Exchange ) everyone thought exactly the same thing about shares in the £1 to £10 range. There would be consolidations of shares trading under £1, splits in stocks trading over £10. And given that we’ve got entirely different numerical ranges here for the same behaviour it’s very difficult indeed to think that it’s the result of anything other than a folk belief, a fetish if you like.
Indeed, there’s one more detail. ADRs are American Depositary Receipts. It’s a way of getting a London (or other market) stock traded on Wall Street and to US retail investors. And traditionally a London quoted stock will put 10 of those London shares into one ADR. Purely and simply to get a stock trading in London in that £1 to £10 range into that $10 to $100 range deemed suitable for New York. No other rhyme nor reason to it than that.
So why have we seen Apple trading up to $700, Google now at $1,000, Priceline over $1,000 (and of course Berkshire Hathaway at whatever $70,000 odd it is) these days when people in the past would have insisted that value could be added by a 10 or 20 to one stock split?
The most obvious answer is that either these companies or the wider market have simply stopped believing that folk tale, simply have got over their fetish about the nominal value of a stock and are now concentrating where they always should have been, on the enterprise value. At least, that’s the best explanation I’ve got and if you’ve a better one please do let me know in the comments.
So , do you want the red pill or blue pill regarding Tech bubble stocks ?

Be careful where you invest or how you manage your investments to not end up like Batista:
ReplyDeletehttp://www.21stcenturynews.com.au/worlds-7th-richest-man-lost-345-billion-year/
Yeah , one might say he has had a tough year , right ?
DeleteI hate that for him :)
Delete