http://www.tfmetalsreport.com/blog/4768/getting-ready
( Interday lows for gold - 1321 and silver about 20 from the April / May timeframe . Do these lows get tested Mon - Wed ? If we see what may be considered a major mid - April sell off Mon - Wed , we just may have near / med term lows for the PMs . )
Getting Ready
I suspect we are about to have a rather consequential week, therefore, here's a Sunday post to get you started.
There's certainly a lot of disgust and angst out there at the price action from Friday. Put me in that category, too. The U.S. unemployment rate rises from 7.5% to 7.6% and it's used as a rationale for a 2.5% selloff in the price of gold? Uhhhmm...yah...that makes a lot of sense. I guess what doesn't make sense is going over it all again as I made my frustration pretty clear in the previous post. In the end, the desperate scheme of The Bullion Banks to transfer as much short obligation onto the backs of the Specs continues unabated.
This week's CoT report showed next-to-nothing in terms of weekly changes to net bullishness or bearishness. The real action, though, sprang forth from the monthly Bank Participation Report. Again, it is this report that many analysts use to calculate the net long or short positions of the individual Bullion Banks...and this month's report is a doozy!
The report shows that not only are the major Bullion Banks no longer net short, they are actually NET LONG gold futures. I've seen one report that suggests this is the first time the Bullion Banks have been NET LONG since 2001. I've also seen a report suggesting that JPM itself is now net long as many as 50,000 contracts! IF this is true, and it's simply a matter of correctly interpreting the data (of course the DATA ITSELF has to be accurate), then there can be NO DOUBT that the precious metals are on the verge of a MAJOR BOTTOM followed by a ferocious rally.
The only thing I'd like to add to the discussion is the rationale for JPM's move into NET LONG territory. The shortages in their gold vaults has been well-documented and clearly this has much to do with it. But there seems to be a lot of curiosity this weekend as to how JPM can be net long so many gold contracts yet still be net short so many silver contracts. The answer likely lies in offshore and OTC positioning, but as this relates directly to The Comex, I think that part of the JPM gold position is actually a hedge against their remaining silver position. Huh? Let me explain.
As you know, I watch the OI and CoT levels pretty closely and I've been banging the drum pretty hard for months about the unusual and exceptionally large Comex Commercial GROSS LONG position. This gross level of Commercial long contracts has historically and consistently fluctuated between 30,000 and 45,000 for the past several years. At price peaks, the gross level would be close to 30,000 and, at price bottoms, the number would rise to somewhere near 45,000. Essentially, these "other commercials" added contracts at lows and then closed them out at highs, making a tidy profit from anticipating how JPM was going to once again fleece the Spec Sheep.
Well, something flipped with this last price cycle. At the lows of last August, the Commercials had again built up a large gross long base (47,797) and, by the time price was capped at the announcement of QE∞ in mid-September, this position had been trimmed back (32,206). During this entire Cartel operation in the nine months since, you would have expected that the Commercial gross long position would have grown again. But, would you have expected this?
DATE PRICE GROSS COMM LONGS
8/14/12 $27.78 47,797
9/11/12 33.46 32,206
10/23/12 31.66 35,786
11/27/12 34.03 42,525
12/31/12 30.29 45,415
2/5/13 31.79 46,293
3/12/13 29.13 51,929
4/9/13 27.97 61,060
5/7/13 23.94 65,703
6/4/13 22.52 66,857
OK, so what the heck does all this mean? I'll try to bring it all together in some sort of coherent form:
- Caught flatfooted and enormously short paper metal at the initiation of QE∞, a deliberate and calculated plan has been orchestrated by the major Bullion Banks, in particular JPMorgan.
- By driving price the price of gold almost $400 lower, The Gold Cartel has been able to reduce their general liability by nearly 80% (http://www.tfmetalsreport.com/blog/4750/speechless-turd) and, by virtue of the latest Bank Participation Report, some Bullion Banks have been able to move NET LONG for the first time in over a decade.
- If reports are correct the JPM has flipped from 50,000 net short to 50,000 net long, we must conclude that the operation to smash gold is close to complete.
- However, even though silver has been smashed a greater price percentage than gold, JPM has been been blunted in their attempts to completely cover their net short silver position as the "other commercials" (who at least on the surface don't appear to be JPM itself) have added at least 20,000 more longs than they have historically ever carried.
- And notice that the gross long position shown above has continued to rise, even in the face of sharply lower prices over the past eight weeks. These are some very deep pockets that, clearly, are not being shaken out. Instead of selling on further weakness, they continue to add.
- JPM could attempt to jam silver prices even lower in an increasingly desperate attempt to frighten these longs but at what cost? By doing so they lose big on their gold position and further exacerbate their already tenuous physical/deliverable gold position.
- And it is this "juggling act" that leads me to think that this entire operation, which began a brutally-long nine months ago, is nearly finished.
You see, by moving so deeply long in gold futures, JPM has effectively hedged much of the remaining silver short position that they've been unable to cover. At its most basic level...if they are forced to cover silver into a rising price, the potential losses they'd incur will be more than equaled by the gains they'd show in gold. (Just for fun...If you're long 50,000 contracts and price rises $500 back to the August 2011 highs, you make $2.5B!)
Now, all of this is well and good and NO DOUBT foreshadows much higher prices for both metals in the weeks ahead. However, none of this is going to matter much to the Spec HFTs which are expected to pounce on the metals this evening, particularly in silver. The fact that China is "closed" through mid-week will only serve to exacerbate the paper price volatility. However, IF I'm right about the ideas laid out above, price should show surprising resilience this week. Gold has been very well bought each and every time that attempts have been made to drive it down through $1350. Let's see if this continues. Silver, too, has hung tough around $22 and has bounced back twice from "shock lows" near $21.


So, I'll close this post the way I began. This is going to be a very consequential week for the metals...one that will tell us a lot about the short-term and intermediate trend for price as we head into summer. Nearly every indicator that I've traditionally followed is indicating that a bottom is near and trend change is coming. Let's see where we go from here.
TF
With talk of the bank participation report reflecting 3 or less bullion banks are now net long , consider the report dated June 4th could reflect a head fake..... As of 6/4 , gold closed at 1400 , then note big spike on 6/6 !

6/6 - gold closed at 1413.70 , we see what happened Friday ( 1384.60 ) and the set up for early next week could test recent lows especially with China on holidays Mon 6/10 through Wed 6/13....

Time will tell but the Bank participation report may not reflect current positioning and game set up by the banksters !
http://silverdoctors.com/cartel-setting-up-epic-metals-raid-as-chinese-markets-closed-mon-wed/
In this week’s Metals & Markets, The Doc & Eric Dubin discuss:
- Friday’s non-farm payroll data – and the paper bullion smash
- The Doc recaps wholesale physical market trends as seen by SD Bullion and the massive demand surge as silver broke below $22 Friday
- Cartel finally busts $22 silver; cartel may attempt to smash gold & silver below April lows of $1320 & $20 overnight Sun and into Monday as Chinese financial markets will be closed Monday through Wednesday
- India freaks-out – but gold quotas on imports & tax hikes will fail
- France attempting to block postal shipments of bullion & cash
- Are capital controls coming to a neighborhood near you?
Download the podcast or click play below, you won’t want to miss this week’s SD Weekly Metals & Markets!
http://www.zerohedge.com/news/2013-06-07/guest-post-don%E2%80%99t-dismiss-possibility-gold-confiscation
( Frankly , after the NSA / Prism disclosures of this week , one has to assume they'll steal gold and silver metals when the need arises ... )
Guest Post: Don’t Dismiss The Possibility Of Gold Confiscation

- default
- Federal Reserve
- Great Depression
- Guest Post
- Hyperinflation
- International Monetary Fund
- Precious Metals
- Reality
- recovery
- World Trade
Submitted by Jeff Thomas via Casey Research,
If you hold precious metals in your portfolio, there is a good chance you fear hyperinflation and the crash of fiat currencies.
You probably distrust governments in general and believe they are self-serving and have no interest in your economic well-being. It is likely that your holdings in gold are your lifeline – your hope to get you through these times while holding on to your wealth.
But have you ever given any thought to the possibility of having this lifeline confiscated by the authorities?
In my conversations with friends and associates, I have often raised this question. The typical responses:
"They'd never do that."
"I'll deal with that if and when it happens."
"I just wouldn't give it to them."
I consider these "wishful thinking" responses.
It's an interesting thought that the greatest threat to gold and silver investment might not be the possibility of losing on the speculation, but the government taking it away from you. It's a thought that I've found few want to even think about, let alone discuss.
If you fall into this camp, you're in good company. Some of the forecasters whom I respect most highly also treat it either as unlikely or at best, "something we may need to look at in the future." To date, in conversing with top advisors worldwide, the two primary reasons they believe gold will not be confiscated are:
- "Confiscation would mean the government acknowledges the reality of the value of gold."
Yes, this is quite so. They would be changing their official view… which, of course, they do all the time. But I submit that all that they need to do is put the proper spin on it.
- "They would meet greater resistance than they did back in '33."
I expect that this is also true, but that a plan will be put in place to deal with that resistance.
We'll address both of these assertions in more detail shortly, but first, a bit of history.
In 1933, Franklin Roosevelt came into office and immediately created the Emergency Banking Act, which demanded that all those who held gold (other than personal jewelry) turn it in to approved banks. Holders were given less than a month to do this. The government then paid them $20.67 per ounce – the going rate at the time. Following confiscation, the government declared that the new value of gold was $35.00. In essence, they arbitrarily increased the value of their newly purchased asset by 69%. (This alone is reason enough to confiscate.)
Today, the US government is in much worse shape than it was in 1933, and it has much more to lose. The US dollar is the default currency of the world, but it's on the ropes, which means the US economic power over the rest of the world is on the ropes.
I think that readers will agree that they will doanything to keep from losing this all-important power.
The US government has essentially run out of options. At some point, the fiat currencies of the First World will collapse, and some other form of payment will be necessary. Yes, the IMF is hoping to create a new default currency, but that, too, is to be a fiat currency. If any country were to produce a gold-backed currency in sufficient supply, that currency would likely become the desired currency worldwide. Fractional backing would be expected.
As most readers will know, the Chinese, Indians, Russians, and others see the opportunity and are building up their gold reserves quickly and substantially. If these countries were to agree to introduce a new gold-backed currency, there can be little doubt that they would succeed in changing the balance of world trade.
That said, the US government is watching these countries just as we are, and they are aware of the threat of gold to them.
The US government ostensibly has approximately 8,200 tonnes of gold in Fort Knox, although this may well be partially or completely missing. Additionally, it ostensibly holds a further 5,000 tonnes of gold in the cellar of the New York Federal Reserve building. Again, there is no certainty that it is there. In general, the authorities don't seem to like independent audits.
In fact, there are rumors that the above vaults are nearly or completely empty and that the above quoted figures exist only on paper rather than in physical form. While there is no way to know this for sure, it's not out of the question.
Either way, if the US and the EU could come up with a large volume of gold quickly, they could issue a gold-backed currency themselves. It's a simple equation: The more gold they have = the more backed notes they can produce = the more power they continue to hold. By seizing upon the private supply of their citizens, they would increase their holdings substantially in short order.
Either that or they could just give up their dominance of world trade and power… What would you guess their choice would be?
It is entirely possible that the US government (and very likely the EU) has already made a decision to confiscate. They may have carefully laid out the plan and have set implementation to coincide with a specific gold price.
So how would this unfold? Let's imagine a fairly extreme scenario and ask ourselves if it could be pulled off effectively:
- The evening news programs announce that the economic recovery is being hampered by wealthy private investors who, by hoarding gold, are skewing the value of the dollar and threatening the middle and poorer classes. The little man is being made to suffer while the rich get richer. A press campaign to equate gold ownership with greed ensues.
- The government announces the Second Emergency Banking Act, advising the public that "the first EBA was instituted by FDR to solve this same problem during the Great Depression. This act was instrumental in helping the little man 'recover.'" (As the average man on the street doesn't know his history nor how wrong this statement is, he'll believe it. Besides, the announcement has a "feel-good" message, and that's all that matters.)
- Possessors of gold, who make up a small minority of the population, would become pariahs. It won't matter that the guy who owns two gold Maple Leafs is not exactly a greedy, rich man. No one will wish to be seen as resisting confiscation. Neither will they wish to go to prison for resisting, no matter how remote the possibility.
- The US pays for the gold in US dollars, which are rapidly headed south. Yes, the Fed will need to print more fiat dollars in order to pay them off, but this suits their purpose, as it inflates the dollar even more. Those who have turned in their gold will do whatever they can to unload the US dollars as quickly as possible and will need to find another investment at a time when there are very few trustworthy investments other than gold. The stock market would likely rise, showing the public how the gold confiscation program is "working."
- One last scary possibility: The government demands that gold is turned in immediately and that settlement will occur following confiscation. After confiscation, it announces that, as there has been such a large number of cases of rich people ripping off the little man, processing them all could take months, possibly even a year or more. A further announcement states that some investors have made an unreasonable profit on the backs of the poor and that they should not be granted this profit. This profit must be returned to the people. (You can almost hear the cheers of the people.) Then it sets about making assessments. The bureaucrats find that most investors do not have formal, acceptable receipts for every coin in their possession. So if you paid $1,200 for a Krugerrand a couple of years ago, you get paid $1,200. If you bought it at $250 in 1999, you get paid $250. But if you have no receipt in an acceptable form, you get a "fair," median payment, say, $500, regardless of when you bought it.
- Appeals: Each investor will be allowed up to one year to appeal the decision of the Treasury as to what is owed him. Of course, the investor knows that the dollar is sinking rapidly and that he would be wise to shut up and take what he is being offered.
Again, this hypothetical scenario is an extreme one. The reader is left to consider just how likely or unlikely this scenario is and what that would mean to his wealth.
But bear this in mind: If the above scenario were to take place soon, the average citizen would have mixed feelings. They would be glad that the "evil rich" had been taken down a peg, but they would worry about the idea of the government taking things by force, because they might be next. It would therefore be in the government's interests to implement confiscation only after the coming panic sets in – after the next crash in the market, after it becomes plain to the average citizen that thisreally is a depression and he really is in big trouble. Then he will be only too glad to see the "greedy rich" go down, and he won't care about the details.
As terrible as the thought is, it seems unlikely to me that the government will not confiscate gold, as they have little to lose and so much to gain.
Those who own gold would prefer to think that this cannot happen, but they have quite a lot riding on that hope and precious little evidence to support it.
It is entirely possible that this scenario will not take place, just as it is possible that confiscation will not take place. The purpose of this article is to spark some serious discussion – both for and against the possibility.
Investors are, by their very nature, planners. It may take a community of investors to develop a legal plan to deal with the above eventuality. Time to get started.
The government can't easily confiscate what's outside its own borders, which is why it's working night and day to make it as difficult as possible for you to protect your assets abroad. This sad reality means that you need to take action before it's too late. Your first step? Learn how to start internationally diversifying your wealth – and your life. From investing in international markets and opening offshore bank accounts to setting up an offshore LLC or annuity, Going Global 2013 will tell you how and where to expatriate your wealth. It also presents solid, up-to-date information on internationalizing your life, from getting a second passport to choosing a good place to live.
Don't allow yourself to be milked by your home government any more. Get started on internationalizing your life today... while it's still possible.
Australian gold fund shut as investors exit
Sydney-based Taurus has shut its precious metals mutual fund as Australian and US investors fled in the wake of gold's recent fall.
Sydney-based Taurus Funds Management Pty Ltd has shut its precious metals mutual fund as Australian and U.S. investors fled after prices of gold began to decline in the beginning of the year, director Gordon Galt told Reuters.
The fund, which at one point held about $250 million in assets under management (AUM), was closed last month after large redemptions reduced the size of the fund. Its AUM was at $120 million as of December, according to Galt.
"We had a number of large investors who decided they no longer wanted to carry the exposure to precious metals," said Galt. "So once the fund got below a certain size, it was not worth continuing to run it."
Gold fell to a two-year low of $1,321.35 in mid-April, its worst two-day drop in 30 years, on fears European countries would liquidate gold reserves.
The metal is down 16 percent this year, after 12 annual gains, as investors switched to higher-yielding stocks. Growing evidence of a recovery in the global economy has hurt bullion's safe-haven appeal.
SPDR Gold Trust, the world's largest gold-backed exchange-traded fund, has seen an unprecedented decline in holdings, which are at a four-year low.
"The investors were changing their mandates and allocations in the first quarter of the year. It was not precipitated by the (April) fall," Galt said.
Galt declined to reveal who the investors were but said they were Australian and U.S. investors. Five employees who were managing the fund have departed the firm, he said.
The Taurus Enhanced Gold and Precious Metals fund has lost about 10 percent of its value this year and nearly 20 percent since its inception in 2011, Thomson Reuters Lipper data showed.
Galt said his firm continued to invest in gold through its private equity funds.
"Our private equity funds still have precious metals exposure in their portfolios. We are not doing anything with those," Galt said. (Editing by Muralikumar Anantharaman)
and...
http://harveyorgan.blogspot.com/2013/06/gold-and-silver-whacked-on-conjunction.html
Saturday, June 8, 2013
Gold and silver whacked on conjunction with the jobs report/GLD declines again/No gold leaves JPMorgan/
Good morning Ladies and Gentlemen:
Gold closed down by $29.60 to $1383.00 (comex closing time). Silver fell by 96 cents to $21.74 (comex closing time)
In the access market at 5:00 pm, gold and silver finished trading at the following prices :
gold: 1384.60
silver: $21.69
Generally whenever the BLS releases its jobs report, you can bet the farm that the bankers are going to raid gold and silver. Also the tend to raid on Fridays, because London England is already put to bed and after 12 pm everything is paper. The bankers also know that the first 3 days of next week, China is off so if there was a great time to raid it was yesterday.
At the Comex, the open interest in silver rose by 674 contracts to 148,551 contracts with silver's rise in price on Thursday by 24 cents. The silver OI is holding firm at elevated levels. No doubt the object of the bank's interest in raiding was silver as the OI has been remaining stubbornly high for many months. The open interest on the entire gold comex contracts rose by 1157 contracts to 376,048 which is extremely low. There is no question that all of the weak speculators in gold have now departed. I do not think that the raid on Friday will result in any further OI losses in gold. The number of ounces which is standing for gold in this June delivery month is 937,500 or 29.16 tonnes.The number of silver ounces remains the same, standing for delivery is represented by 620,000 oz. No doubt this level will climb as the June month proceeds.
Tonight, the Comex registered or dealer gold remains at 1.475 million oz or 45.87 tonnes. This is getting dangerously low. The total of all gold at the comex rose slightly and now it is just below the 8 million oz at 7.970 million oz or 247.9 tonnes of gold.
The GLD reported another loss in gold inventory to the tune of .6 tonnes. The SLV inventory of silver also remained firm with no losses.
This morning we have great physical commentaries from Gene Arensberg who reports on the Banking Participation report and he discloses that for the first time 4 major banks are now net long in gold. This is very exciting and worth your attention.
The second excellent report on silver is presented by Steve D'Angelo of SRSRocco where he makes claim that we should pay more attention to silver's investment demand than to its industrial demand. This is a well thought out paper and you will enjoy reading it.
We have two Kingworld presentations. The first with Keith Barron, where he pounds the table that gold is moving from west to east via the liquidation of GLD.
The second interview is with Phillipa Malmgren, former assistant to the President Working Group (a.k.a.plunge protection team). She states that gold is manipulated and if anybody should know, it would be here.
We will go over these and many other stories but first.....................
Let us now head over to the comex and assess trading over there today.
Here are the details:
The total gold comex open interest rose by 1157 contracts from 374,891 up to 376.048 with gold rising by $15.10 on Thursday. The front active month of June saw it's OI fall by 783 contracts from 2950 down to 2167. We had 826 contracts served upon our longs yesterday. We thus gained 43 contracts or 4300 additional oz that will stand this month. The next delivery month is the non active July contract and here the OI fell by 40 contracts down to 532. The next active delivery month for gold is August and here the OI rose by 1314 contracts from 214,870 up to 216,184. The estimated volume on Friday was very good at 197,521 contracts. The confirmed volume on Thursday was also good at 185,418 contracts.
The total silver Comex OI completely plays to a different drummer than gold. Its OI rose again by a fair sized 668 contracts to 148,551, with silver's rise in price to the tune of 24 cents on Thursday. The front non active June silver contract month shows a loss in OI contracts of 11 contracts. We had 11 notices filed on Friday so in essence we neither gained nor lost any silver ounces standing for metal for the June contract month. The estimated volume on Friday was enormous, coming in at 79,624 contracts. The confirmed volume Thursday was also good at at 76,306.
We had 1 customer deposits today: (very strange for a huge delivery month of June. Also note no gold entering into JPM whether by dealer or by customer accounts)
i) Into Scotia; 24,626.984 oz
total customer deposit: 24,626.984 oz
We had 0 customer withdrawals today:
total customer withdrawal: nil oz
If you will recall, we needed to see 100,000 oz of gold removed from JPMorgan's customer account. (1000 contracts served upon our longs in mid May).
Tuesday, we had 15,416.93 oz removed from the JPM's customer account. No doubt that this gold was part of the 1000 contracts issued by JPMorgan customer account and thus we calculated that as of last night 28,389.579 oz was settled upon, leaving 71,611.00 oz still left to arrive in the settling process.
In summary on the customer side of things for JPMorgan:
Wednesday we had 333 notices served upon by JPMorgan's customer side.
Thursday morning we received notice that we had 826 notices served upon of which 725 contracts were issued by JPMorgan's customer account and 10 notices from their house or dealer account.
Friday morning, 318 notices were filed and of that total 317 notices were issued by JPMorgan and all of these were on their client or customer account. At 3:30 we wanted to see if any of this gold actually left JPMorgan's customer account.
Nope!! none left. (Actually no gold left its dealer account as well!!)
I guess JPMorgan's customer account cannot settle because there is no gold inside the customer account to settle upon!!
We had no adjustments.
Thus tonight we have the following closing inventory figures for JPMorgan:
i) dealer account: 413,526.284 oz
ii) customer account 354,225.571 oz.
Now for JPMorgan's dealer side and what the inventory should be:
Tuesday night we reported that 4935 contracts have been issued by JPMorgan's house account since first day notice and not yet subtracted out of inventory
You will also recall on Saturday and Monday night, I reported that JPMorgan had 470,322.102 oz in it's dealer account. From that day until now, 58,795.82 oz was either withdrawn or adjusted out, leaving the dealer side Thursday and Friday night at 413,526.284 oz
On the dealer side Thursday we had 10 notices issued on JPMorgan's dealer account
On Friday: zero
Thus, 4945 contracts have been issued so far for 494,500 oz and these
ounces have yet to settle from JPMorgan's dealer side.
JPMorgan's dealer vault registers tonight 413,526.284 oz
somehow we have a huge negative balance as i) the gold has not left JPMorgan's dealer account and has yet to settle
and
ii) it is now deficient by 80,974 oz (413,526 inventory - 494,500 oz issued = 80,974 oz)
In other words, the entire 413,526 must be first transferred out of Morgan's dealer category leaving it with zero, plus the 80,974 of additional gold
JPMorgan has not had any deposits in gold in quite some time.
How will JPMorgan satisfy this shortfall??
HSBC 's dealer vault gold is also slim as it remains at: 260,323.275 oz (8.09 tonnes)
7526 contracts x 100 oz per contract or 752,600 oz served upon + 1849 contracts or 184,900 oz (left to be served upon) = 937,500 oz or 29.16 tonnes of gold.
We gained 43 contracts or 4,300 additional oz of gold will stand for the June contract month.
We now have the official USA production of gold last year and it registered 230 tonnes. Thus approximately 19.16 tonnes of gold is produced by all mines in the USA per month. Thus the amount standing for gold this month represents 152.19% of that total production.
i) out of CNT: 15,767.333 oz
ii) out of Scotia: 1024.90 oz
total customer withdrawal : 16.792.233 oz
Gold closed down by $29.60 to $1383.00 (comex closing time). Silver fell by 96 cents to $21.74 (comex closing time)
In the access market at 5:00 pm, gold and silver finished trading at the following prices :
gold: 1384.60
silver: $21.69
Generally whenever the BLS releases its jobs report, you can bet the farm that the bankers are going to raid gold and silver. Also the tend to raid on Fridays, because London England is already put to bed and after 12 pm everything is paper. The bankers also know that the first 3 days of next week, China is off so if there was a great time to raid it was yesterday.
At the Comex, the open interest in silver rose by 674 contracts to 148,551 contracts with silver's rise in price on Thursday by 24 cents. The silver OI is holding firm at elevated levels. No doubt the object of the bank's interest in raiding was silver as the OI has been remaining stubbornly high for many months. The open interest on the entire gold comex contracts rose by 1157 contracts to 376,048 which is extremely low. There is no question that all of the weak speculators in gold have now departed. I do not think that the raid on Friday will result in any further OI losses in gold. The number of ounces which is standing for gold in this June delivery month is 937,500 or 29.16 tonnes.The number of silver ounces remains the same, standing for delivery is represented by 620,000 oz. No doubt this level will climb as the June month proceeds.
Tonight, the Comex registered or dealer gold remains at 1.475 million oz or 45.87 tonnes. This is getting dangerously low. The total of all gold at the comex rose slightly and now it is just below the 8 million oz at 7.970 million oz or 247.9 tonnes of gold.
The GLD reported another loss in gold inventory to the tune of .6 tonnes. The SLV inventory of silver also remained firm with no losses.
This morning we have great physical commentaries from Gene Arensberg who reports on the Banking Participation report and he discloses that for the first time 4 major banks are now net long in gold. This is very exciting and worth your attention.
The second excellent report on silver is presented by Steve D'Angelo of SRSRocco where he makes claim that we should pay more attention to silver's investment demand than to its industrial demand. This is a well thought out paper and you will enjoy reading it.
We have two Kingworld presentations. The first with Keith Barron, where he pounds the table that gold is moving from west to east via the liquidation of GLD.
The second interview is with Phillipa Malmgren, former assistant to the President Working Group (a.k.a.plunge protection team). She states that gold is manipulated and if anybody should know, it would be here.
We will go over these and many other stories but first.....................
Here are the details:
The total gold comex open interest rose by 1157 contracts from 374,891 up to 376.048 with gold rising by $15.10 on Thursday. The front active month of June saw it's OI fall by 783 contracts from 2950 down to 2167. We had 826 contracts served upon our longs yesterday. We thus gained 43 contracts or 4300 additional oz that will stand this month. The next delivery month is the non active July contract and here the OI fell by 40 contracts down to 532. The next active delivery month for gold is August and here the OI rose by 1314 contracts from 214,870 up to 216,184. The estimated volume on Friday was very good at 197,521 contracts. The confirmed volume on Thursday was also good at 185,418 contracts.
The total silver Comex OI completely plays to a different drummer than gold. Its OI rose again by a fair sized 668 contracts to 148,551, with silver's rise in price to the tune of 24 cents on Thursday. The front non active June silver contract month shows a loss in OI contracts of 11 contracts. We had 11 notices filed on Friday so in essence we neither gained nor lost any silver ounces standing for metal for the June contract month. The estimated volume on Friday was enormous, coming in at 79,624 contracts. The confirmed volume Thursday was also good at at 76,306.
Comex gold/May contract month:
June 7/2013
the June contract month:
the June contract month:
Ounces
| |
Withdrawals from Dealers Inventory in oz
|
nil
|
Withdrawals from Customer Inventory in oz
|
nil
|
Deposits to the Dealer Inventory in oz
|
nil
|
Deposits to the Customer Inventory, in oz
| 24,626.984 oz |
No of oz served (contracts) today
|
318 (31,800 oz)
|
No of oz to be served (notices)
|
1849 (184,900 oz
|
Total monthly oz gold served (contracts) so far this month
|
7526 (752,600 oz)
|
Total accumulative withdrawal of gold from the Dealers inventory this month
|
39,657.389 oz
|
Total accumulative withdrawal of gold from the Customer inventory this month
| 35,324.352 oz |
We again had tiny activity at the gold vaults
The dealer had 0 deposits and 0 dealer withdrawals.
We had 1 customer deposits today: (very strange for a huge delivery month of June. Also note no gold entering into JPM whether by dealer or by customer accounts)
i) Into Scotia; 24,626.984 oz
total customer deposit: 24,626.984 oz
We had 0 customer withdrawals today:
total customer withdrawal: nil oz
If you will recall, we needed to see 100,000 oz of gold removed from JPMorgan's customer account. (1000 contracts served upon our longs in mid May).
Tuesday, we had 15,416.93 oz removed from the JPM's customer account. No doubt that this gold was part of the 1000 contracts issued by JPMorgan customer account and thus we calculated that as of last night 28,389.579 oz was settled upon, leaving 71,611.00 oz still left to arrive in the settling process.
In summary on the customer side of things for JPMorgan:
Wednesday we had 333 notices served upon by JPMorgan's customer side.
Thursday morning we received notice that we had 826 notices served upon of which 725 contracts were issued by JPMorgan's customer account and 10 notices from their house or dealer account.
Friday morning, 318 notices were filed and of that total 317 notices were issued by JPMorgan and all of these were on their client or customer account. At 3:30 we wanted to see if any of this gold actually left JPMorgan's customer account.
Nope!! none left. (Actually no gold left its dealer account as well!!)
I guess JPMorgan's customer account cannot settle because there is no gold inside the customer account to settle upon!!
We had no adjustments.
Thus tonight we have the following closing inventory figures for JPMorgan:
i) dealer account: 413,526.284 oz
ii) customer account 354,225.571 oz.
Now for JPMorgan's dealer side and what the inventory should be:
Tuesday night we reported that 4935 contracts have been issued by JPMorgan's house account since first day notice and not yet subtracted out of inventory
You will also recall on Saturday and Monday night, I reported that JPMorgan had 470,322.102 oz in it's dealer account. From that day until now, 58,795.82 oz was either withdrawn or adjusted out, leaving the dealer side Thursday and Friday night at 413,526.284 oz
On the dealer side Thursday we had 10 notices issued on JPMorgan's dealer account
On Friday: zero
Thus, 4945 contracts have been issued so far for 494,500 oz and these
ounces have yet to settle from JPMorgan's dealer side.
JPMorgan's dealer vault registers tonight 413,526.284 oz
somehow we have a huge negative balance as i) the gold has not left JPMorgan's dealer account and has yet to settle
and
ii) it is now deficient by 80,974 oz (413,526 inventory - 494,500 oz issued = 80,974 oz)
In other words, the entire 413,526 must be first transferred out of Morgan's dealer category leaving it with zero, plus the 80,974 of additional gold
JPMorgan has not had any deposits in gold in quite some time.
How will JPMorgan satisfy this shortfall??
HSBC 's dealer vault gold is also slim as it remains at: 260,323.275 oz (8.09 tonnes)
Tonight the dealer inventory remains tonight at a low of 1.475 million oz (45.87) tonnes of gold. The total of all gold slightly rises, resting tonight at 7.970 million oz or 248.18 tonnes.
Friday we had 318 notices served upon our longs for 31,800 oz of gold. In order to calculate what I believe will stand for delivery in June, I take the OI standing for June (2167) and subtract out Friday's notices (318) which leaves us with 1849 contracts or 184,900 oz left to be served upon our longs.
Friday we had 318 notices served upon our longs for 31,800 oz of gold. In order to calculate what I believe will stand for delivery in June, I take the OI standing for June (2167) and subtract out Friday's notices (318) which leaves us with 1849 contracts or 184,900 oz left to be served upon our longs.
Thus we have the following gold ounces standing for metal in June:
7526 contracts x 100 oz per contract or 752,600 oz served upon + 1849 contracts or 184,900 oz (left to be served upon) = 937,500 oz or 29.16 tonnes of gold.
We gained 43 contracts or 4,300 additional oz of gold will stand for the June contract month.
We now have the official USA production of gold last year and it registered 230 tonnes. Thus approximately 19.16 tonnes of gold is produced by all mines in the USA per month. Thus the amount standing for gold this month represents 152.19% of that total production.
end
now let us head over and see what is new with silver:
now let us head over and see what is new with silver:
Silver:
June 7.2013: June silver contract month:
| Silver |
Ounces
|
| Withdrawals from Dealers Inventory | nil |
| Withdrawals from Customer Inventory | 16,792,233 oz (CNT, Scotia) |
| Deposits to the Dealer Inventory | 1,223,933.535 oz (Delaware, HSBC,Scotia) |
| Deposits to the Customer Inventory | nil |
| No of oz served (contracts) | 0 (nil oz) |
| No of oz to be served (notices) | 91 (455,000 oz) |
| Total monthly oz silver served (contracts) | 33 (165,000 oz) |
| Total accumulative withdrawal of silver from the Dealers inventory this month | 701,301.63 oz |
| Total accumulative withdrawal of silver from the Customer inventory this month | 2,005,487.6 oz |
Today, we had good activity inside the silver vaults.
we had 0 dealer deposits and 0 dealer withdrawals.
We had 3 customer deposits:
i) Into Delaware: 1001.100 oz
ii) Into HSBC: 600,574.16 oz
iii) Into Scotia: 622,358.275 oz
total customer deposit; 1,223,933.535 oz oz
We had 2 customer withdrawals:
We had 3 customer deposits:
i) Into Delaware: 1001.100 oz
ii) Into HSBC: 600,574.16 oz
iii) Into Scotia: 622,358.275 oz
total customer deposit; 1,223,933.535 oz oz
We had 2 customer withdrawals:
i) out of CNT: 15,767.333 oz
ii) out of Scotia: 1024.90 oz
total customer withdrawal : 16.792.233 oz
we had 0 adjustments today
Registered silver at : 42.035 million oz
total of all silver: 164.650 million oz.
The CME reported that we had nil notices filed for zero oz on Friday. In order to calculate what we believe will stand in the month of June, I take the Oi standing for June (91) and subtract out Friday's notices (0) which leaves us with 91 notices or 455,000 oz.
Thus the total number of silver ounces standing in this non active delivery month of June is as follows:
33 contracts x 5000 oz per contract (served) = 110,000 oz + 91 contracts x 5000 oz or 455,000 oz left to be served upon = 620,000 oz
we neither gained nor lost any silver ounces today at the Comex silver.
Now let us check on gold inventories at the GLD first: basically flat from Thursday , just .6 tons of gold lifted from GLD ETF inventories....
June 7.2013:
June 6.2013:
http://www.caseyresearch.com/gsd/edition/chris-powell-the-debate-on-gold-infiltrates-the-mainstream
( Just the data , articles at the link... )


June 7.2013:
Tonnes1,007.14
Ounces32,380,584.27
Value US$44.855 billion
June 6.2013:
Tonnes1,007.74
Ounces32,399,917.19
Value US$45.334 billion
selected news and views.....
( Just the data , articles at the link... )
¤ YESTERDAY IN GOLD & SILVER
The gold price didn't do much of anything during Far East and most of London trading. But the moment that the jobs report came out, gold got whacked right away. What a surprise! Gold's low tick [$1,376.90 spot] came at 11:30 a.m. EDT...and rebounded slightly during the rest of the New York trading day.
Gold closed on Friday at $1,384.60 spot...down $29.10...and back below the $1,400 spot price mark once again. Gross volume was an eye-watering 211,000 contracts.
As the Kitco chart below indicates...silver, JPMorgan's problem child...got singled out for special attention. After trading in a tight 20 cent trading range through all of the Far East and most of the London session, silver got smoked at the release of the jobs report. Silver low [around $21.50 according to Kitco] didn't occur until around 3:45 p.m. in electronic trading, more than four hours after the low price tick was in for gold.
Also, according to Kitco, the high tick shortly after 8:30 a.m. EDT was $22.80, so silver had an intraday price move of $1.30...almost 6 percent.
Silver closed in New York at $21.69 spot...down 90 cents from Thursday's close. Net volume was very chunky at 59,500 contracts.
Platinum traded in a 20 dollar range in overnight trading...and was basically flat by the Comex open. The funny thing about platinum was that the price didn't get smacked until just before 9:00 a.m. EDT...not at the release of the jobs report. Platinum got hit for over 40 bucks in New York trading, but recovered a chunk of that as the day wore on.
Palladium got hit the same time as platinum, but recovered most of its losses by the close of trading.
For the Friday trading session, gold closed down 2.06%...silver was down 3.96%...platinum closed down 1.70%...and palladium was off 0.66%.
The dollar index closed in New York late Thursday afternoon at 81.59. From there it traded lower...hitting its low in the Far East [81.25] during the Hong Kong lunch hour. From there it recovered a bit before rolling over once again, with a quick spike down at the release of the jobs report at 8:30 a.m. in New York. The low tick was 81.14. But someone was there to catch a falling knife...and by the 9:30 open of the equity markets, the index was back at 81.70...and traded pretty flat after that. The dollar index closed at 81.66...up 8 ticks on the day.
It should be obvious that the goings-on in the currency markets had zero to do with the happenings in the precious metals. This was strictly a JPMorgan et al affair from start to finish.
* * *
The CME's Daily Delivery Report showed that 132 gold and zero silver contracts were posted for delivery on Tuesday...and it was, once again, "all the usual suspects". JPMorgan Chase as the only short/issuer of note, with 131 contracts out of its client account. HSBC USA was the long/stopper on 76 contracts...and Barclays took delivery of 52 contracts. The link to yesterday's Issuers and Stoppers Report is here.
There was a tiny withdrawal out of GLD yesterday...19,333 troy ounces. This was probably a fee payment of some kind. And as of 10:13 p.m. EDT last night, there were no reported changes in SLV.
Joshua Gibbons, the Guru of the SLV Bar List, updated his Internet site with the bar information over at SLV for the week ending Wednesday, June 5th. Here is part of his brief comments..."Analysis of the 05 June bar list, and comparison to the previous week's list...1,110,225.2 troy oz. were removed (all from Brinks London), no bars were added or had a serial number change." The link to his website...and the rest of his comments...is here.
The U.S. Mint had a smallish sales report yesterday. They sold 5,000 ounces of gold eagles and 1,500 one-ounce 24K gold buffaloes. So far this month, the mint has sold 17,000 ounces of gold eagles...4,500 one-ounce 24K gold buffaloes...and 782,000 silver eagles. Based on this data, the silver/gold sales ratio is a bit over 36 to 1.
It was a fairly busy day in silver over at the Comex-approved depositories on Thursday. They reported receiving 1,223,933 troy ounces...and shipped out a smallish 16,792 troy ounces. The link to that activity is here.
In gold, the received 24,626 troy ounces on that day...and didn't ship any out. All of it went into Scotia Mocatta. The link to that activity is here.
As far as the Commitment of Traders Report...there's nothing to report. There were no meaningful changes in the Commercial net short position in silver...which still sits at 42.0 million ounces...and in gold, the Commercial net short position increased by about 240,000 ounces...and now sits at 6.17 million ounces.
The under-the-hood corrections from the prior week's 'screwy' COT Report that Ted Butler was sort of expecting, did not materialize...and I just know he'll have more to say about it in his commentary later today. I'll steal what I think I can get away with and post it in my Tuesday column.
I'm not even going to bother posting Nick Laird's most excellent "Days to Cover" chart because it looks the same as the one I posted last week.
However, the June Bank Participation Report [for positions held at the close of Comex trading on Tuesday, June 4th] was a horse of an entirely different colour. For the last month or so, Ted has been going on about the fact that JPMorgan has now positioned itself on the long side of the gold market...and lo and behold, that was proven to be the case [in spades] in yesterday's BPR...as they are now mega-long gold in the Comex Futures market. But silver comes first.
In silver, what the report showed was that '3 or less' U.S. banks were net short 18,924 Comex silver contracts [94.6m oz]...an improvement from 21,873 silver contracts [109.4m oz] held short in the May report. Based on this data, Ted has revised his estimate of JPMorgan's silver short position down to about 15,000 contracts [75m oz]. Of the approximately 4,000 contracts [20m oz] remaining in the June report...and held by the other two U.S. banks...I'd bet that HSBC USA holds [at minimum] 3,000 contracts [15m oz] of that amount all by itself. The remaining short position would be held by Citigroup...and in the grand scheme of things, it's immaterial.
As I've always said...there are only two U.S. banks involved in the silver price management scheme...and that is JPMorgan and HSBC USA. This report proves that nothing has changed, except that JPM is heading for the exits as quickly as it can.
Also in silver, there were 14 non-U.S. banks that collectively held 12,163 Comex contracts net short in the June report. This is up slightly from the 11,168 Comex contracts they held net short in the May report. I'd bet serious money that well over 50 percent of that 12,163 contract figure is held by Canada's Bank of Nova Scotia. The remaining contracts, divided up between the other 13 non-U.S. banks, are immaterial. Here's the chart...
(Click on image to enlarge)
And now for gold.
What the June Bank Participation Report shows was that '3 or less' U.S. bullion banks are now net long the gold market to the tune of 29,622 contracts [2.96 million ounces]. The May report showed these same three U.S. banks were net short the Comex futures market in gold by 16,610 contracts [1.66 million ounces]. That's a change of 46,232 Comex gold contracts in less than a month!
Also in gold, there were 21 non-U.S. banks that were net short 25,040 Comex gold contracts [2.54m oz] between them. That's an increase from the 22,474 Comex gold contracts [2.25m oz] they held short in the May report. Once again, the lion's share of that 25,040 contracts I believe to be held by Canada's Bank of Nova Scotia. And if you divide up what remains between the other 20 non-U.S. banks that hold short positions in the Comex future market, you'll see at a glance that their short positions are immaterial in the grand scheme of things.
Here's gold's Bank Participation Report in graphic form courtesy of Nick Laird...
(Click on image to enlarge)
For fun, I thought I'd do the same exercise for both platinum and palladium...but only for the month of June.
In platinum, there are 4 U.S. Banks short 11,971 Comex platinum contracts...and 15 non-U.S. banks are short 1,422 Comex platinum contracts between them. Most of the short position held by the 4 U.S. banks would be JPMorgan as well...and the short positions of the 15 non-U.S. banks, divided up equally, is less than 100 contracts per bank.
(Click on image to enlarge)
In palladium, '3 or less' U.S. banks are short 8,970 palladium contracts...and 14 non-U.S. banks are short 3,485 palladium contracts. Once again, it's a good bet that almost all of the Comex short positions held by the U.S. bullion banks are held by JPMorgan Chase...and the 14 non-U.S. banks are short, on average, 250 contracts apiece...which is also immaterial.
(Click on image to enlarge)
Gene Arensberg report on stunning development on the 4 big USA banks with respect to gold
In the latest CFTC Monthly Bank Participation Report, these 4 banks went from being net short 16,781 contracts to net long by 29,622
Gene Arensberg:
"In the June 7 CFTC Monthly Bank Participation Report category for U.S. Banks please note an interesting and some might think stunning change. Recall last month that (less than four) U.S. banks reported being 16,781 contracts net short gold futures. As of June 4, (still less than four*) U.S. banks reported a NET LONG position of 29,622 contracts.
So as gold fell from $1452 on May 7 to $1399 on June 4, call it $53 or 3.7%, the U.S. banks flipped from net short to net long by a total difference of 46,403 lots, from 16,781 contracts net short to 29,622 contracts net long. That is certainly interesting and we just about have to put that on the bullish side of the COT ledger, do we not? Here is what it looks like in chart form. "
(courtesy Gene Arensberg/GATA/Chris Powell)
Gene Arensberg report on stunning development on the 4 big USA banks with respect to gold
In the latest CFTC Monthly Bank Participation Report, these 4 banks went from being net short 16,781 contracts to net long by 29,622
Gene Arensberg:
"In the June 7 CFTC Monthly Bank Participation Report category for U.S. Banks please note an interesting and some might think stunning change. Recall last month that (less than four) U.S. banks reported being 16,781 contracts net short gold futures. As of June 4, (still less than four*) U.S. banks reported a NET LONG position of 29,622 contracts.
So as gold fell from $1452 on May 7 to $1399 on June 4, call it $53 or 3.7%, the U.S. banks flipped from net short to net long by a total difference of 46,403 lots, from 16,781 contracts net short to 29,622 contracts net long. That is certainly interesting and we just about have to put that on the bullish side of the COT ledger, do we not? Here is what it looks like in chart form. "
|
Gene Arensberg: Big commercial traders in gold futures go long big
Submitted by cpowell on Fri, 2013-06-07 21:40. Section: Daily Dispatches
5:48p ET Friday, June 7, 2013
Dear Friend of GATA and Gold:
The Got Gold Report's Gene Arensberg flashes tonight that U.S. banks, some of the four biggest commercial traders in gold futures, have reversed position dramatically in a month from net short to strongly net long. Arensberg's flash is posted at the Got Gold Report here:
CHRIS POWELL, Secretary/Treasurer
Gold Anti-Trust Action Committee Inc.
Former PPT member gives credence to gold market manipulation
Submitted by cpowell on Fri, 2013-06-07 17:35. Section: Daily Dispatches
1:35p ET Friday, June 7, 2013
Dear Friend of GATA and Gold:
Philipa Malmgren, a former presidential assistant and former member of the President's Working Group on Financial Markets, better known as the Plunge Protection Team, acknowledges today in an interview with King World News that governments devaluing their currencies might have an interest in manipulating the gold market. Malmgren, now an adviser to large financial institutions, adds that many of her clients are wary about investing in gold because they believe it is subject to "heart-stopping" volatility from manipulation. An excerpt from the interview is posted at the King World News blog here:
CHRIS POWELL, Secretary/Treasurer
Gold Anti-Trust Action Committee Inc.
Silver Investment Demand: The Ticking Time Bomb
Even though silver investment demand has picked up recently due to the lowest prices in over two years, this may be just the tip of the iceberg for what is to come in the future. Currently, only a small fraction of investors understand silver’s future potential but that will change in the next few years.
Presently, the Main Stream Media bandwagon has been quite busy putting out bearish analysis on silver demand and price. Whether it’s due to a decline of industrial demand or a lack of silver investment by those in India, there doesn’t seem to be a shortage of this sort of commentary. However, this should not be a concern for those who understand the true fundamentals in owning silver.
The underlying problem with this present bearish commentary is that it is so typical coming from an industry that provides forecasts based on superficial, outdated and manipulated data. The world’s financial system is being propped up by trillions of dollars of worthless paper instruments that have totally distorted the market’s ability to value assets correctly. Some of these so-called assets are severely inflated, while others such as silver, are tremendously undervalued.
Severely Inflated Supposed Assets
According to the Investment Company Institute’s Q4 2012 report, the U.S. Retirement Market was valued at $19.5 trillion, up from $19.3 trillion in previous quarter:
Q4 2012 Retirement Market Break-down (in trillions)
IRA’s = $5.4
DC Plans = $5.0
Private DB Plans = $2.5
State & Local Govt Pension = $3.2
Federal Pension Plans = $1.6
Annuities = $1.7
TOTAL = $19.5 trillion
Now, if we compare that data to the ownership of gold and silver, we have the following:
 Here we can see just how insignificant precious metal investment is compared to the total U.S. Retirement market. Furthermore, the current total value of the GLD & SLV is only worth 1% of the entire United States IRA market.
How can this be? How did the public get hoodwinked into owning such a large degree of paper assets when gold used to be apart of an individual’s portfolio in the past? The answer to that question is probably due to the public suffering from four decades of amnesia since the dollar was backed by gold.
The financial system is in a complete mess. The only thing holding the global paper facade together is the continued monetary stimulus and bond purchasing by the world’s central banks. This sort of activity has a lifespan, whose death may be close at hand.
Here we can see just how insignificant precious metal investment is compared to the total U.S. Retirement market. Furthermore, the current total value of the GLD & SLV is only worth 1% of the entire United States IRA market.
How can this be? How did the public get hoodwinked into owning such a large degree of paper assets when gold used to be apart of an individual’s portfolio in the past? The answer to that question is probably due to the public suffering from four decades of amnesia since the dollar was backed by gold.
The financial system is in a complete mess. The only thing holding the global paper facade together is the continued monetary stimulus and bond purchasing by the world’s central banks. This sort of activity has a lifespan, whose death may be close at hand.
Silver Investment Demand & Price
An error that many typical analysts make today, is to produce a silver price forecast based on industrial demand. Even though industrial demand is one of the forces that impacts the price, investment demand has been the overwhelming factor in the past several years.
 From 2005, when the price of silver really started to take off and until 2011 when it hit a new annual high of $35.12, industrial demand mainly fluctuated between 450 & 500 million oz. However, total investment demand (coin-medal & implied net investment) rose from nearly 100 million oz in 2005 to over 250 million oz by 2012. It was due to this huge increase of investment demand during this period that pushed the price of silver to new highs.
Unfortunately for the precious metal investors in 2011, high silver prices generated levels of investment demand too rich for central banker’s blood. So after a record of 5 margin hikes on future’s contracts in May, 2011 and constant market rigging by central banks, silver investment demand declined in 2012.
This can be spotted quite easily if we look at official coin & medal demand (shown by the bars at the bottom of the chart) versus the price of silver in the graph above. As official silver coin sales increased from 40 million in 2007 to a peak of 118 million in 2011, the price of silver increased and peaked at the same time. But as demand for official coins such as Silver Eagles and Canadian Maples declined 21% to only 93 million oz in 2012, the price of silver fell along with it.
Furthermore, this was true with silver bar investment. According to the data from the 2013 World Silver Survey, silver bar investment declined from 100.6 million oz in 2011 to nearly half in 2012 at 53 million oz. In just one year, investment demand from these two sources declined 73 million oz (33%).
From 2005, when the price of silver really started to take off and until 2011 when it hit a new annual high of $35.12, industrial demand mainly fluctuated between 450 & 500 million oz. However, total investment demand (coin-medal & implied net investment) rose from nearly 100 million oz in 2005 to over 250 million oz by 2012. It was due to this huge increase of investment demand during this period that pushed the price of silver to new highs.
Unfortunately for the precious metal investors in 2011, high silver prices generated levels of investment demand too rich for central banker’s blood. So after a record of 5 margin hikes on future’s contracts in May, 2011 and constant market rigging by central banks, silver investment demand declined in 2012.
This can be spotted quite easily if we look at official coin & medal demand (shown by the bars at the bottom of the chart) versus the price of silver in the graph above. As official silver coin sales increased from 40 million in 2007 to a peak of 118 million in 2011, the price of silver increased and peaked at the same time. But as demand for official coins such as Silver Eagles and Canadian Maples declined 21% to only 93 million oz in 2012, the price of silver fell along with it.
Furthermore, this was true with silver bar investment. According to the data from the 2013 World Silver Survey, silver bar investment declined from 100.6 million oz in 2011 to nearly half in 2012 at 53 million oz. In just one year, investment demand from these two sources declined 73 million oz (33%).
A Brief Word on Precious Metal Manipulation
Surprisingly, there is still a great deal of debate on the validity of precious metal manipulation in the market place. There are some very well known precious metal analysts who think the whole idea of market rigging is just plain silly. To them, it’s just a matter of supply and demand. However this is indeed the problem at hand.
How on earth can the markets value a commodity properly when the majority of central banks in the world are manipulating and controlling the value of their respective fiat currencies via Treasury and Bond purchases? By continued manipulation of the bond and currency markets, the central banks have forced artificial demand in paper assets while attempting to destroy physical demand in gold and silver
Global Silver Investment Demand: A Ticking Time Bomb
This next chart shows just how much silver investment demand has increased in the past five years.
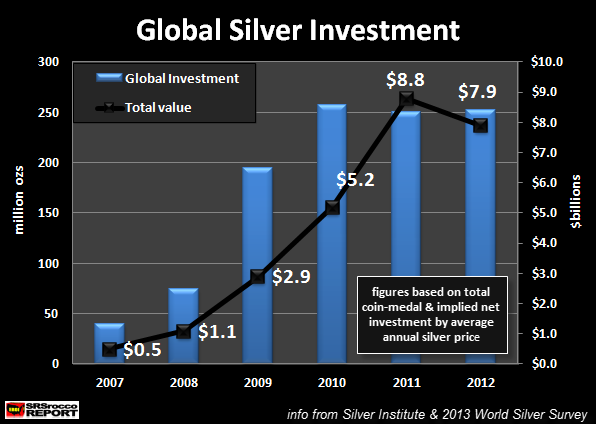 In 2007, total global silver investment was valued a $500 million. However, five years later this amount grew to nearly $8 billion in 2012. While that sounds like a great deal, this figure seems insignificant compared to the dollar amounts being thrown around the world today.
If we were to add up all global silver investment from 2007 to 2012 we would end up with a total of $26.4 billion. That’s right… $26.4 billion. It is a very paltry figure when we realize the Fed purchases $85 billion a month of U.S. Treasuries and MBS – Mortgaged Backed Securities.
Just think about it, the Fed bought more in MBS in the month of May than was invested in silver by the world in the past five years. When we examine these two figures together, it puts it into perspective just how out of whack the whole system has become.
The central banks will continue with the insanity of using monetary stimulus to prop up the world’s financial markets until the whole system implodes. Once the Fed and central banks lose control of over the paper game, there will be a mad rush out of paper instruments and into physical assets.
Not many realize it, but Silver investment demand is a ticking time bomb.
In 2007, total global silver investment was valued a $500 million. However, five years later this amount grew to nearly $8 billion in 2012. While that sounds like a great deal, this figure seems insignificant compared to the dollar amounts being thrown around the world today.
If we were to add up all global silver investment from 2007 to 2012 we would end up with a total of $26.4 billion. That’s right… $26.4 billion. It is a very paltry figure when we realize the Fed purchases $85 billion a month of U.S. Treasuries and MBS – Mortgaged Backed Securities.
Just think about it, the Fed bought more in MBS in the month of May than was invested in silver by the world in the past five years. When we examine these two figures together, it puts it into perspective just how out of whack the whole system has become.
The central banks will continue with the insanity of using monetary stimulus to prop up the world’s financial markets until the whole system implodes. Once the Fed and central banks lose control of over the paper game, there will be a mad rush out of paper instruments and into physical assets.
Not many realize it, but Silver investment demand is a ticking time bomb.
http://twoshortplanksunplugged.blogspot.com.au/2013/06/chinas-goldreserves-how-big-is-elephant.html
China’s Gold Reserves: How big is the Elephant in the room?
This is of course a subject where almost everyone’s opinion - other than the Intelligence agencies of the world (Mi6, Mi5, CIA, MSS, Mossad, FSB {KGB}, SIS, CSIS, ASIS, DCRI, BND etc) - is based upon both seemingly factual data, and varying degrees of artistic licence when attempting to fill the gaps.
What I would like to do in this post is address what I believe the level of China’s Gold Reserves will be by the end of 2013.
First of all, let’s look at the World Gold Council’s data set for World Gold Holdingsfrom February 2012.
According to the World Gold Council, China’s Gold Reserves as of publishing was at 1,054.1 tonnes, but China updates its’ data (tells the world) once every 18 months, and what they have and what they choose to tell may be two completely different things, so there’s a giant hole in our understanding right from the start.
Assuming that the World Gold Council isn’t telling Porky Pies - and I very much doubt they are – we must look toward the possibility and indeed probability, that China themselves are not disclosing true and accurate information of their Gold Holdings and/or Gold accumulation habits. Given their past and present distortions of data, infrequent, sudden and retrospective announcements (most notably that they had already acquired over 400 tonnes back in 2008, and then 1,054.1 back in late 2009) I would need to conclude that China more than likely hides much of their position. In a previous post I wrote: “Personally, I believe they are very close, but that they will always claim to be in an Under-Dog position when in fact they’re building an overshoot position. You can blame Sun Tzu for that crap, “Appear weak when you are strong, and strong when you are weak”.
So let’s see if we can get a rough picture, starting with a 2008-9 Gold Reserve figure of 1.054.1 tonnes.
If we look at China’s importation of Gold from Hong Kong, we can identify a trend of increased purchase sizes with a few, possibly opportunistic, larger purchases along the way, as you can see in the graph from Zero Hedge below.

The graph shows an average purchase of 83.31 tonnes per month over a 16 month period. If we use some approximate figures and assume a sliding scale from 30 tonnes per month back in 2009 to 85 tonnes per month in 2013, we can then place a figure of 3,360 tonnes being imported from Hong Kong and into China since 2009.
(2009/360t, 2010/480t, 2011/660t, 2012/840t, 2013/1020t).
We are able to attain seemingly reliable figures of Gold imports to China out of Hong Kong, but what of other sources? For instance, does China produce 400 tonnes of Gold each year? Does China accrue Gold through foreign swaps (Aid, Arms, Oil, Food) of some sort?
In regards to mining, let’s assume China’s Gold production has been steadily growing, on average, at say 64% every 10 years (as the graph below illustrates). That means China’s annual production from mining should be around 355 tonnes per year as of 2013. So, if we use a sliding scale of China’s production from 280 tonnes per year in 2009, to 355 tonnes per year in 2013, we get a figure of 1,590 tonnes since 2009.
(2009/280t, 2010/300t, 2011/320t, 2012/340t, 2013/360t).
 In regards to foreign swaps, and for argument sake, let’s assume China does indeed do a reasonable amount of back-door Gold importing with and through its northern and north eastern neighbours, as part of commodity and goods swaps. Let’s assume a sliding scale figure of just 20 tonnes per year back in 2009 to 100 tonnes per year in 2013, that’s 300 tonnes from unknown foreign dealings since 2009.
(2009/20t, 2010/40t, 2011/60t, 2012/80t, 2013/100t).
let’s just add-up what we have so far;
World Gold Council (2009).....1,054.1 tonnes
Imports from Hong Kong (2009-13).....3,360 tonnes
China’s Gold production (2009-13).....1,590 tonnes
Foreign Gold swaps (2009-13).....300 tonnes
Total (estimates) Gold Reserves.....6,304.1 tonnes @ End 2013
In a previous post, I discussed the need for China to attain a specific level of Gold Reserves:
“Knowing the Chinese, they’re more than likely acquiring physical at a rate beyond most people’s estimates, and, knowing their philosophy in business, they’ll overshoot whatever notional tonnage figure was assigned to them, or for which they themselves may have ascribed in order to be on par with US Gold Reserves to GDP.
US GDP is $14.99 T, Gold Res is 8,133.5 tonnes….that’s 542.6 tonnes per trillion dollars.
China GDP is $7.32 T, Gold Res is 1,054.1 tonnes….that’s 144.0 tonnes per trillion dollars.
China needs 3,971.8 tonnes to be at the same Gold Reserves to GDP ratio as the US.”
So, has China surpassed the 6,000 tonne mark already…has China reached their “Overshoot” position?
If China has amassed 6,300 tonnes already, then it has hit 860 tonnes per trillion dollars GDP and increased it's position just shy of 600%.
When we look for possible answers to this question, I cannot help it that the first thing which hits me is the recent history of both the past and present Chinese Presidents (Hu Jintao and Xi Jinping) have been touring much like a US President tours with their First ladies. The mind of the Chinese is different usually; head down and work hard until you have made it, then, once you have made it, hold your head up like the Emperor.
Has China already made it...ie, has China surpassed the United States Gold Reserves to GDP figure of "542.6 tonnes per trillion dollars" ?
If you wish to read more on my reasoning behind China’s feverish Gold buying habits, here are the links:http://twoshortplanksunplugged.blogspot.com.au/2013/05/gold-silver-real-estate-and-next-move.html
http://twoshortplanksunplugged.blogspot.com.au/2013/06/gold-and-three-elephants-in-room-gold.html
http://twoshortplanksunplugged.blogspot.com.au/2013/05/kumbaya-currencies-will-bow-to-gold.html
Submitted by cpowell on Fri, 2013-06-07 21:40. Section: Daily Dispatches
5:48p ET Friday, June 7, 2013
Dear Friend of GATA and Gold:
The Got Gold Report's Gene Arensberg flashes tonight that U.S. banks, some of the four biggest commercial traders in gold futures, have reversed position dramatically in a month from net short to strongly net long. Arensberg's flash is posted at the Got Gold Report here:
CHRIS POWELL, Secretary/Treasurer
Gold Anti-Trust Action Committee Inc. |
Former PPT member gives credence to gold market manipulation
Submitted by cpowell on Fri, 2013-06-07 17:35. Section: Daily Dispatches
1:35p ET Friday, June 7, 2013
Dear Friend of GATA and Gold:
Philipa Malmgren, a former presidential assistant and former member of the President's Working Group on Financial Markets, better known as the Plunge Protection Team, acknowledges today in an interview with King World News that governments devaluing their currencies might have an interest in manipulating the gold market. Malmgren, now an adviser to large financial institutions, adds that many of her clients are wary about investing in gold because they believe it is subject to "heart-stopping" volatility from manipulation. An excerpt from the interview is posted at the King World News blog here:
CHRIS POWELL, Secretary/Treasurer
Gold Anti-Trust Action Committee Inc.
Gold Anti-Trust Action Committee Inc.
Silver Investment Demand: The Ticking Time Bomb
Even though silver investment demand has picked up recently due to the lowest prices in over two years, this may be just the tip of the iceberg for what is to come in the future. Currently, only a small fraction of investors understand silver’s future potential but that will change in the next few years.
Presently, the Main Stream Media bandwagon has been quite busy putting out bearish analysis on silver demand and price. Whether it’s due to a decline of industrial demand or a lack of silver investment by those in India, there doesn’t seem to be a shortage of this sort of commentary. However, this should not be a concern for those who understand the true fundamentals in owning silver.
The underlying problem with this present bearish commentary is that it is so typical coming from an industry that provides forecasts based on superficial, outdated and manipulated data. The world’s financial system is being propped up by trillions of dollars of worthless paper instruments that have totally distorted the market’s ability to value assets correctly. Some of these so-called assets are severely inflated, while others such as silver, are tremendously undervalued.
Severely Inflated Supposed Assets
According to the Investment Company Institute’s Q4 2012 report, the U.S. Retirement Market was valued at $19.5 trillion, up from $19.3 trillion in previous quarter:
Q4 2012 Retirement Market Break-down (in trillions)
IRA’s = $5.4
DC Plans = $5.0
Private DB Plans = $2.5
State & Local Govt Pension = $3.2
Federal Pension Plans = $1.6
Annuities = $1.7
TOTAL = $19.5 trillion
Now, if we compare that data to the ownership of gold and silver, we have the following:
Here we can see just how insignificant precious metal investment is compared to the total U.S. Retirement market. Furthermore, the current total value of the GLD & SLV is only worth 1% of the entire United States IRA market.
How can this be? How did the public get hoodwinked into owning such a large degree of paper assets when gold used to be apart of an individual’s portfolio in the past? The answer to that question is probably due to the public suffering from four decades of amnesia since the dollar was backed by gold.
The financial system is in a complete mess. The only thing holding the global paper facade together is the continued monetary stimulus and bond purchasing by the world’s central banks. This sort of activity has a lifespan, whose death may be close at hand.
Silver Investment Demand & Price
An error that many typical analysts make today, is to produce a silver price forecast based on industrial demand. Even though industrial demand is one of the forces that impacts the price, investment demand has been the overwhelming factor in the past several years.
From 2005, when the price of silver really started to take off and until 2011 when it hit a new annual high of $35.12, industrial demand mainly fluctuated between 450 & 500 million oz. However, total investment demand (coin-medal & implied net investment) rose from nearly 100 million oz in 2005 to over 250 million oz by 2012. It was due to this huge increase of investment demand during this period that pushed the price of silver to new highs.
Unfortunately for the precious metal investors in 2011, high silver prices generated levels of investment demand too rich for central banker’s blood. So after a record of 5 margin hikes on future’s contracts in May, 2011 and constant market rigging by central banks, silver investment demand declined in 2012.
This can be spotted quite easily if we look at official coin & medal demand (shown by the bars at the bottom of the chart) versus the price of silver in the graph above. As official silver coin sales increased from 40 million in 2007 to a peak of 118 million in 2011, the price of silver increased and peaked at the same time. But as demand for official coins such as Silver Eagles and Canadian Maples declined 21% to only 93 million oz in 2012, the price of silver fell along with it.
Furthermore, this was true with silver bar investment. According to the data from the 2013 World Silver Survey, silver bar investment declined from 100.6 million oz in 2011 to nearly half in 2012 at 53 million oz. In just one year, investment demand from these two sources declined 73 million oz (33%).
A Brief Word on Precious Metal Manipulation
Surprisingly, there is still a great deal of debate on the validity of precious metal manipulation in the market place. There are some very well known precious metal analysts who think the whole idea of market rigging is just plain silly. To them, it’s just a matter of supply and demand. However this is indeed the problem at hand.
How on earth can the markets value a commodity properly when the majority of central banks in the world are manipulating and controlling the value of their respective fiat currencies via Treasury and Bond purchases? By continued manipulation of the bond and currency markets, the central banks have forced artificial demand in paper assets while attempting to destroy physical demand in gold and silver
Global Silver Investment Demand: A Ticking Time Bomb
This next chart shows just how much silver investment demand has increased in the past five years.
In 2007, total global silver investment was valued a $500 million. However, five years later this amount grew to nearly $8 billion in 2012. While that sounds like a great deal, this figure seems insignificant compared to the dollar amounts being thrown around the world today.
If we were to add up all global silver investment from 2007 to 2012 we would end up with a total of $26.4 billion. That’s right… $26.4 billion. It is a very paltry figure when we realize the Fed purchases $85 billion a month of U.S. Treasuries and MBS – Mortgaged Backed Securities.
Just think about it, the Fed bought more in MBS in the month of May than was invested in silver by the world in the past five years. When we examine these two figures together, it puts it into perspective just how out of whack the whole system has become.
The central banks will continue with the insanity of using monetary stimulus to prop up the world’s financial markets until the whole system implodes. Once the Fed and central banks lose control of over the paper game, there will be a mad rush out of paper instruments and into physical assets.
Not many realize it, but Silver investment demand is a ticking time bomb.
http://twoshortplanksunplugged.blogspot.com.au/2013/06/chinas-goldreserves-how-big-is-elephant.html
China’s Gold Reserves: How big is the Elephant in the room?
This is of course a subject where almost everyone’s opinion - other than the Intelligence agencies of the world (Mi6, Mi5, CIA, MSS, Mossad, FSB {KGB}, SIS, CSIS, ASIS, DCRI, BND etc) - is based upon both seemingly factual data, and varying degrees of artistic licence when attempting to fill the gaps.
What I would like to do in this post is address what I believe the level of China’s Gold Reserves will be by the end of 2013.
First of all, let’s look at the World Gold Council’s data set for World Gold Holdingsfrom February 2012.
According to the World Gold Council, China’s Gold Reserves as of publishing was at 1,054.1 tonnes, but China updates its’ data (tells the world) once every 18 months, and what they have and what they choose to tell may be two completely different things, so there’s a giant hole in our understanding right from the start.
Assuming that the World Gold Council isn’t telling Porky Pies - and I very much doubt they are – we must look toward the possibility and indeed probability, that China themselves are not disclosing true and accurate information of their Gold Holdings and/or Gold accumulation habits. Given their past and present distortions of data, infrequent, sudden and retrospective announcements (most notably that they had already acquired over 400 tonnes back in 2008, and then 1,054.1 back in late 2009) I would need to conclude that China more than likely hides much of their position. In a previous post I wrote: “Personally, I believe they are very close, but that they will always claim to be in an Under-Dog position when in fact they’re building an overshoot position. You can blame Sun Tzu for that crap, “Appear weak when you are strong, and strong when you are weak”.
So let’s see if we can get a rough picture, starting with a 2008-9 Gold Reserve figure of 1.054.1 tonnes.
If we look at China’s importation of Gold from Hong Kong, we can identify a trend of increased purchase sizes with a few, possibly opportunistic, larger purchases along the way, as you can see in the graph from Zero Hedge below.

The graph shows an average purchase of 83.31 tonnes per month over a 16 month period. If we use some approximate figures and assume a sliding scale from 30 tonnes per month back in 2009 to 85 tonnes per month in 2013, we can then place a figure of 3,360 tonnes being imported from Hong Kong and into China since 2009.
(2009/360t, 2010/480t, 2011/660t, 2012/840t, 2013/1020t).
(2009/360t, 2010/480t, 2011/660t, 2012/840t, 2013/1020t).
We are able to attain seemingly reliable figures of Gold imports to China out of Hong Kong, but what of other sources? For instance, does China produce 400 tonnes of Gold each year? Does China accrue Gold through foreign swaps (Aid, Arms, Oil, Food) of some sort?
In regards to mining, let’s assume China’s Gold production has been steadily growing, on average, at say 64% every 10 years (as the graph below illustrates). That means China’s annual production from mining should be around 355 tonnes per year as of 2013. So, if we use a sliding scale of China’s production from 280 tonnes per year in 2009, to 355 tonnes per year in 2013, we get a figure of 1,590 tonnes since 2009.
(2009/280t, 2010/300t, 2011/320t, 2012/340t, 2013/360t).
(2009/280t, 2010/300t, 2011/320t, 2012/340t, 2013/360t).

In regards to foreign swaps, and for argument sake, let’s assume China does indeed do a reasonable amount of back-door Gold importing with and through its northern and north eastern neighbours, as part of commodity and goods swaps. Let’s assume a sliding scale figure of just 20 tonnes per year back in 2009 to 100 tonnes per year in 2013, that’s 300 tonnes from unknown foreign dealings since 2009.
(2009/20t, 2010/40t, 2011/60t, 2012/80t, 2013/100t).
(2009/20t, 2010/40t, 2011/60t, 2012/80t, 2013/100t).
let’s just add-up what we have so far;
World Gold Council (2009).....1,054.1 tonnes
Imports from Hong Kong (2009-13).....3,360 tonnes
China’s Gold production (2009-13).....1,590 tonnes
Foreign Gold swaps (2009-13).....300 tonnes
Total (estimates) Gold Reserves.....6,304.1 tonnes @ End 2013
Imports from Hong Kong (2009-13).....3,360 tonnes
China’s Gold production (2009-13).....1,590 tonnes
Foreign Gold swaps (2009-13).....300 tonnes
Total (estimates) Gold Reserves.....6,304.1 tonnes @ End 2013
In a previous post, I discussed the need for China to attain a specific level of Gold Reserves:
“Knowing the Chinese, they’re more than likely acquiring physical at a rate beyond most people’s estimates, and, knowing their philosophy in business, they’ll overshoot whatever notional tonnage figure was assigned to them, or for which they themselves may have ascribed in order to be on par with US Gold Reserves to GDP.
US GDP is $14.99 T, Gold Res is 8,133.5 tonnes….that’s 542.6 tonnes per trillion dollars.
China GDP is $7.32 T, Gold Res is 1,054.1 tonnes….that’s 144.0 tonnes per trillion dollars.
China needs 3,971.8 tonnes to be at the same Gold Reserves to GDP ratio as the US.”
China GDP is $7.32 T, Gold Res is 1,054.1 tonnes….that’s 144.0 tonnes per trillion dollars.
China needs 3,971.8 tonnes to be at the same Gold Reserves to GDP ratio as the US.”
So, has China surpassed the 6,000 tonne mark already…has China reached their “Overshoot” position?
If China has amassed 6,300 tonnes already, then it has hit 860 tonnes per trillion dollars GDP and increased it's position just shy of 600%.
When we look for possible answers to this question, I cannot help it that the first thing which hits me is the recent history of both the past and present Chinese Presidents (Hu Jintao and Xi Jinping) have been touring much like a US President tours with their First ladies. The mind of the Chinese is different usually; head down and work hard until you have made it, then, once you have made it, hold your head up like the Emperor.
Has China already made it...ie, has China surpassed the United States Gold Reserves to GDP figure of "542.6 tonnes per trillion dollars" ?
If you wish to read more on my reasoning behind China’s feverish Gold buying habits, here are the links:http://twoshortplanksunplugged.blogspot.com.au/2013/05/gold-silver-real-estate-and-next-move.html
http://twoshortplanksunplugged.blogspot.com.au/2013/06/gold-and-three-elephants-in-room-gold.html
http://twoshortplanksunplugged.blogspot.com.au/2013/05/kumbaya-currencies-will-bow-to-gold.html
http://twoshortplanksunplugged.blogspot.com.au/2013/06/gold-and-three-elephants-in-room-gold.html
http://twoshortplanksunplugged.blogspot.com.au/2013/05/kumbaya-currencies-will-bow-to-gold.html
No comments:
Post a Comment