http://silverdoctors.com/silver-smashed-10-on-globex-open-tests-20/#more-26816

http://www.zerohedge.com/news/2013-05-19/silver-plunges-yen-stop-surge-triggers-margin-liquidation
 Submitted by Tyler Durden on 05/19/2013 18:18 -0400

http://www.caseyresearch.com/gsd/edition/naive-to-think-gold-isnt-manipulated-too-fund-manager-john-butler-says


http://harveyorgan.blogspot.com/2013/05/usa-exports-of-gold-in-janfeb-equal-to.html
SILVER SMASHED 10% ON GLOBEX OPEN, TESTS $20
 Precisely as we

http://www.zerohedge.com/news/2013-05-19/silver-plunges-yen-stop-surge-triggers-margin-liquidation
Silver Plunges As Yen Stop Surge Triggers Margin Liquidation
Not a moment after someone was slammed with a massive margin call following the hit of 102 USDJPY stops as we noted moments ago, was that same someone(s) forced to dump a whole lot of silver in thin, no volume trading taking out the entire bid stack on what can only be described as "get me the hell out and pay me anything" liquidation, sending the precious metal to just over $20, before yet another round of buying programs kicked in, and sent it right back up, allowing those quick enough to capitalize on some foolish macro trader's blowing up to pocket a huge profit before Japan has even woken up.

Thank you Kuroda, Bernanke and co for this total farce of a "market."
http://www.caseyresearch.com/gsd/edition/naive-to-think-gold-isnt-manipulated-too-fund-manager-john-butler-says
¤ YESTERDAY IN GOLD & SILVER
The gold price traded around the $1,380 spot price mark through all of Far East and most of the London session on Friday. But minutes after the equity markets opened in New York, the gold price got sold down twenty bucks in short order...and the subsequent rally didn't get far. Once the Comex closed, the gold price got sold down to its low of the day in thin access market trading.
The low price tick came at precisely 4:00 p.m. EDT in New York...and Kitco recorded that as $1,354.60 spot. After that, it recovered a few dollars doing into the close of electronic trading.
Gold closed at $1,360.20 spot...down $25.70 on the day. Net volume was very high...around 193,000 contracts.
The silver price was more 'volatile' on Friday. It topped out around the $22.80 mark around 10:00 a.m. in Tokyo...and was as low as $22.40 shortly after the Comex opened in New York. The subsequent rally ran into selling just after 9:30 a.m. EDT...just like gold.
From there, the silver price got sold down until the close of London trading, which was 11:00 a.m. in New York...and the anemic rally that followed ended just after 1:00 p.m. Then, like gold, silver got sold down in the thinly-traded electronic market...and the low price tick came at, or very close to 4:00 p.m. EDT in New York. That was pretty much it for the day.
Silver's low tick was recorded as $22.09 spot.
Silver closed the Friday trading session at $22.26 spot...down 43 cents from Thursday's close. Gross volume was around the 46,000 contract mark.
The dollar index closed in New York at 83.745 late Thursday afternoon...and then traded in a tight range just under the 84.00 mark right up until 8:00 a.m. EDT. Then away it went to the upside...and almost all the gains were in by 9:20 a.m...ten minutes before the equity markets opened in New York. The high tick was 84.31...and it sold off just a hair going into the close, finishing the Friday session at 84.21...up 47 basis points on the day.
Gold and silver didn't even begin to seriously sell off until about fifteen minutes after the big dollar index rally was done, so to pin yesterday's precious metal price action on the currencies is laughable.
One of the other reasons that the sell-offs in the metal are hitting the shares so hard, is that mutual funds are feeling the effects of massive redemptions...and they have to sell whether they want to or not. The markets are very illiquid...and this just makes matters worse.
But the one big question you should be asking yourself is this..."Who is buying all these shares that the precious metals investors are selling in such a panic?" Think about it. Somebody is...and whoever they are [and I have my suspicions] they have infinitely deep pockets...and are the very definition of "strong hands".
The CME's Daily Delivery Report showed that zero silver and 157 silver contracts were posted for delivery on Tuesday within the Comex-approved depositories. The big short/issuers were ABN Amro and Jefferies...with 120 and 29 contracts respectively. The two largest long/stoppers were, once again, the ringleaders in the silver price management scheme...Canada's Bank of Nova Scotia with 113 contracts, and JPMorgan Chase with 30 contracts. The link to yesterday's Issuers and Stoppers Report is here.
GLD had another withdrawal by an authorized participant yesterday. This time 96,987 troy ounces were removed for parts unknown. SLV had a big withdrawal as well, as 2,220,839 troy ounces were taken out.
The U.S. Mint reported selling another 3,000 ounces of gold eagles yesterday...and that was it. Month-to-date the mint has reported selling 45,000 ounces of gold eagles...9,000 one-ounce 24K gold buffaloes...and 1,733,500 silver eagles. Based on these figures, the silver/gold sales ratio is just over 31 to 1. Without question that ratio would be much higher if the mint was able to produce all the silver eagles that were required...and as the mint has already stated publicly, it could produce more if it had the necessary blanks.
Over at the Comex-approved depositories on Thursday, they reported receiving only one good delivery bar of silver, weighing in a 1,019.900 troy ounces...but they shipped 856,973 troy ounces of the stuff out the door. The link to that activity is here.
In gold on Thursday, these same depositories reported receiving 65,425 troy ounces of the stuff...and shipped 64,659 ounce of same out the door. All the activity was at Scotia Mocatta...and the link to that is here.
The Commitment of Traders Report, for positions held at the 1:30 p.m. EDT close of Comex trading on Tuesday, was pretty much as I had hoped/expected...as there were small improvements in the Commercial net short positions in both gold and silver.
In silver, the Commercial net short position declined by 6.2 million ounces...and currently sits at 66.1 million ounces. Not a record low, but within hailing distance, that's for sure...and I'll have more to say about this in 'The Wrap'.
Ted Butler said that JPMorgan's short position didn't change much from the previous reporting week...and is still around the 18,000 contract mark, or 90 million ounces...which represents 136% of the Commercial net short position. That's outrageous!!! If their short position vanished overnight, the remaining Commercial traders would be net long the Comex silver market...just like the traders in the other two COT categories...and we'd have a 3-digit silver price in a heartbeat.
The total open interest in silver is reported as 144,666 contracts...but if you dip in the Disaggregated COT Report, you find that of that amount...36,620 of these contracts are market-neutral spread trades. So the true open interest in silver is only 108,046 contracts...and once you remove them from the equation, the concentrated short positions of the major players really stand out.
In silver, the Big 4 traders are short 34.1 percent of the entire Comex futures market, once you subtract out all the b.s. market-neutral spread trades. In troy ounces, that 34.1 percent represents 184.4 million ounces...two and a half times the entire Commercial net short position!
And, according to the monthly Bank Participation Report in silver, only three big bullion banks actually matter, so in fact, it's the Big 3...not the Big 4. They are JPMorgan Chase, Canada's Bank of Nova Scotia...and HSBC USA. The short position of the 4th largest bank is immaterial.
The '5 through 8' largest traders are short an additional 10.6 percent of the Comex silver market...but at well under 3% each, they just don't matter in the grand scheme of things.
But, in total, the Big 8 traders are short 45% of the entire Comex silver market...and that's aminimum number. You can't make this stuff up.
In gold, the Commercial net short position declined by 357,300 troy ounces during the reporting week...and now sits at 8.41 million ounces.
There are spread trades in gold as well...and the ones that are visible in the Disaggregated COT Report total 75,170 contracts. The total open interest shows as 443,806 contracts...and subtracting out these market-neutral spread trades leaves a true open interest of 368,636 contracts.
In actual fact, dear reader, there are more spread trades than are being shown in this report, but if they showed all spread trades, then the true concentrations of all the market participants would become instantly apparent...and that's precisely why the report doesn't show them all. That's why I say that the true concentrations are actually higher, but it's impossible to know by how much.
Anyway, the Big 4 are short 8.30 million ounces of gold...virtually 100% of the Commercial net short position of 8.41 million ounces. On a 'net' basis, they are short 22.5 percent of the entire Comex gold market. The '5 through 8' traders are short 4.39 million ounces of gold...and that represents an additional 11.9 percentage points of the Comex gold market.
So, the Big 8 are short 151% of the Commercial net short position in gold...and short 34.4% of the entire Comex futures market in gold.
But to show you how much more concentrated the short position is in silver vs. gold...the Big 4 are short 257% of the Commercial net short position in silver. In gold, the Big 4 are short 98.7% of the Commercial net short position. Both figures are outrageous and obscene...and the CME Group does nothing, the CFTC does nothing...and the precious metals mining companies do nothing. As I said a few paragraphs ago...you couldn't make this stuff up.
Here's Nick Laird's most excellent "Days of World Production to Cover Short Positions" chart. Except for the willfully blind, it tells you all you need to know at a glance.
(Click on image to enlarge)
I haven't spoken about how business has been at the bullion store recently, so I shall make amends now. There's no question that business has slowed down quite a bit now that we're four weeks past the big engineered price decline. Deliveries of bullion are still an issue, but somewhat better than they were ten days ago. However, because of the long-term 'special relationship' that the story owner has had with his bullion supplier, this 'better' delivery situation many not be applicable across the board for all bullion stores.
The wholesaler's premiums have come down a bit, but are still quite elevated compared to what they were before April 16th when all hell broke loose...and we're nowhere near being back to what I would consider 'normal'. We aren't able to offer the same discount on future orders that we used to be able to...but I suspect that the situation will slowly revert back to 'normal' over time.
The other things that aren't 'normal' anymore is the level of business activity...and the internal structure of it. I would estimate the silver sales are permanently higher by 25 to 50% on a daily basis, than the baseline amount that our store did prior to April 15th. And if that isn't impressive enough, I'd estimate gold sales are up between 300 and 500% now that things are 'back to normal'. This new level of activity is going to take some getting used to...and it will be interesting to see how the mints cope with this new demand structure as time marches on.
Of course these demand figures, whether local, national...or international, are price sensitive...and bear watching closely. But many customers are mentioning the fact that they are grateful that the precious metals are "on sale"...and as long as they are, demand is certain to remain strong.
selected news and views.....
This Is No Ordinary Scandal: Wall Street Journal
We are in the midst of the worst Washington scandal since Watergate. The reputation of the Obama White House has, among conservatives, gone from sketchy to sinister, and, among liberals, from unsatisfying to dangerous. No one likes what they're seeing. The Justice Department assault on the Associated Press and the ugly politicization of the Internal Revenue Service have left the administration's credibility deeply, probably irretrievably damaged. They don't look jerky now, they look dirty. The patina of high-mindedness the president enjoyed is gone.
Something big has shifted. The standing of the administration has changed.
As always it comes down to trust. Do you trust the president's answers when he's pressed on an uncomfortable story? Do you trust his people to be sober and fair-minded as they go about their work? Do you trust the IRS and the Justice Department? You do not.
This op-ed piece by Peggy Noonan showed up in The Wall Street Journal on Thursday...and I found it in yesterday's edition of the King Report.
Doug Noland: Financial Euphoria
From my perspective, the global nature of excesses and fragilities is the most worrying aspect to the current Financial Euphoria. Essentially, the entire world faces acute financial and economic instability. The entire world suffers from a widening gulf between inflating asset prices and mounting economic vulnerabilities. Seemingly the entire world suffers from an increasingly protracted period of near-zero rates, aggressive central bank monetary stimulus and a desperate search for market returns. The entire global financial “system” is an over-liquefied speculative Bubble – stoked by central bankers responding desperately to acute financial and economic fragilities.
As noted above, find a speculative Bubble and there will be an underlying source of monetary disorder. From my perspective, Bubbles are at their core about a self-reinforcing over-issuance of mispriced finance. Major market misperceptions are integral to fueling Bubbles – and these misperceptions are often associated with some form of government support/backing of the underlying Credit financing the boom.
These days, the dynamic of over-issued, mispriced finance is a global phenomenon – the U.S., Europe, Japan, China, Asia and the “developing” economies. The perception that central bankers will ensure ongoing asset inflation is an unprecedented global phenomenon. The collapse in yields and risk premiums in debt markets across the globe is unlike anything I’ve ever witnessed or studied historically. These days, asset inflation, speculation and Bubbles prevail virtually everywhere. Moreover, the gulfs between inflating assets and weakening economic fundamentals seemingly widen everywhere, as Financial Euphoria engulfs debt and equity securities markets around the world. As noted this week by the great market watcher and historian Art Cashin: This market is unlike anything we’ve ever experienced.
Doug's Credit Bubble Bulletin, posted on the prudentbear.com Internet site every Friday, is always a must read...and yesterday evening's edition is no exception. I thank reader U.D. for sending it along.
A Brazilian WTO chief could prove painful for the West
Late last Tuesday, after months of intense lobbying, and campaigning visits to 47 countries, Roberto Azevedo was confirmed as the next director general of the World Trade Organisation.
Amidst the Queen’s Speech and the resignation of a certain football manager, Azevedo’s appointment barely flickered on the U.K. news radar. Yet it was an event of some significance that could have major implications for the future shape of the global economy.
While less well-known than the International Monetary Fund, the WTO is the most important economic multilateral on earth. With 159 member states, this Geneva-based organisation can be likened to a vast and highly specialised international court, designed to arbitrate on complex trade disputes between governments that come into conflict, so as to keep protectionism in check.
If a nation feels another is unfairly blocking its exports, it complains to the WTO. Ranks of in-house lawyers then interpret international trade rules and issue an independent judgment. If countries found guilty don’t comply, then all members are meant to stop trading with them and close ranks — although it very rarely comes to that.
This story appeared on the telegraph.co.uk Internet site last Saturday...and it's been sitting in my in-box since then, awaiting a spot in today's column. I thank Roy Stephens for his first offering of the day.
Five King World News Blogs
1. Andrew Maguire [#1]: "Physical Demand Shows Gold in Massive Bull Market". 2. Egon von Greyerz: "Coming Collapse, Massive Global Debt and the Bernanke Fed". 3. Art Cashin [#1]: "Shorts Being Squeezed and Market May Go Parabolic". 4. Andrew Maguire: [#2]: "Bullion Banks Are About to Exploit Gold and Silver". 5. Art Cashin [#2]: "Money Supply Going Parabolic, Gold and Inflation".
Sprott's Thoughts: Where is the Gold Coming From?
We have tried to balance supply and demand figures in the gold market to answer a 15 year old question - “where is the supply of gold coming from?” In 1998, Frank Veneroso first suggested that it was the Western Central Banks that were supplying the market and we’ve been looking for a smoking gun ever since.
We have published our research several times, but none has got more attention amongst gold-watchers than our two pieces on the activities of Western Central Banks. In the Markets at a Glance entitled “Do Western Central Banks Have Any Gold Left Part II” we surmised that more than 4,500 tonnes of gold was exported by the United States between 1991 and 2012. Further, we postulated that it must have come from the US Government as they would be the only viable provider of metal in this quantity. There is no other seller in the market that could explain the discrepancy in these import/export figures. Let’s review the updated figures and then examine some expert opinions.
This short commentary by Eric Sprott and David Franklin was posted on thesprottgroup.com Internet site yesterday...and is definitely worth reading.
Mine union threatens to bring South Africa to 'standstill'
The leader of South Africa's biggest platinum mining union threatened on Friday to bring Africa's No. 1 economy "to a standstill" and demanded a meeting with President Jacob Zuma, ramping up the rhetoric in an 18-month labor crisis.
The rand, which tumbled to a four-year low against the dollar on Thursday on fears of a strike at Anglo American Platinum (Amplats), extended its slide on concerns about further disruptions to an already struggling economy.
The currency fell as low as 9.4334, its lowest since April 2009 when emerging markets were still reeling from the effects of the global financial crisis.
A protest strike called for Friday by at least two AMCU officials failed to materialize as all workers reported for the morning shift as normal.
This Reuters story was filed from Rustenburg, South Africa...and posted on their Internet site early yesterday morning EDT.
John Butler – QE and a Misesian crack up boom
Alasdair Macleod chatted with John Butler, author of The Golden Revolution and the Amphora Report investment newsletter.
John briefly details his motives for writing his book, before the discussion moves onto the latest knockdown in gold against the current news stories regarding global demand.
From weak hands to strong, from West to East, from paper to physical, once a floor is found and the physical supply becomes tight, both Alasdair and John agree that the market will then start to clear at higher prices.
This 27-minute podcast, posted on the goldmoney.com Internet site on Thursday, is certainly worth your time. I thank Elliot Simon for digging it up for us.
¤ THE WRAP
The cat is still stuck up the tree and we don’t know how to get it down. Keynes would suggest building a bigger ladder. Hayek would wait for the cat to jump down of its own accord. The European approach involves chopping the tree down. - Economist George Akerlof at an IMF conference on rethinking macroeconomics
Today's pop 'blast from the past' takes me back to my hippy days of the mid-1960s in Toronto. This is the first time I've heard this song in about forty-five years...and if you're of that age, you should know it right away. The link to the youtube.com video is here.
Richard Addinsell's Warsaw Concerto was written for the 1941 film Dangerous Moonlight, and continues to be a popular concert and recording piece. The film-makers wanted something in the style of Sergei Rachmaninoff, but were unable to persuade Rachmaninoff himself to write a piece. Roy Douglas orchestrated the concerto. It has been recorded over one hundred times and has sold in excess of three million copies.
As was common with film music until the 1950s, many of Addinsell's scores were destroyed by the studios as it was assumed there would be no further interest in them. However, recordings of his film music have been issued since his death, reconstructed by musicologist and composer Philip Lane from the soundtracks of the films themselves which, knowing orchestral music as well as I do, I find amazing!
I posted this classical piece several years back, but thought I'd post it again. Here's Philip Fowke doing the honours. The video quality could be better, but the musicianship and interpretation is hard to beat. The link to the youtube.com video is here.
So...are we done yet?
As bad as the last few days have been, JPMorgan et al haven't succeeded in taking out the Far East lows set on the morning of April 16th in Hong Kong. They came within pennies in silver...but missed gold's old low by thirty-five bucks.
Unless they can find more longs prepared to sell, or tech funds prepared to go short this far below the major moving averages, 'da boyz' can't get the prices any lower than this. As Ted Butler said on the phone yesterday, the slices off the salami to the downside are getting thinner with each passing day. There are limits to how low they can get prices...and we may have reached them at 4:00 p.m. EDT yesterday in New York.
And even if they do succeed early next week, the reward for their efforts will be pretty meager. We'll just have to wait and see what developments await us next week.
The three days of price declines that we've experienced since the Tuesday cut-off for yesterday's Commitment of Trader Report, has probably set new lows in a lot of categories...and if prices remain subdued for Monday and Tuesday, the Commitment of Traders Report this coming Friday should be something to see as well...provided all the data is reported in a timely manner.
A quick glance at any gold or silver chart reveals what may be the classic double bottom formation from a market technician's point of view. But it wasn't formed by free-market forces. It was courtesy of JPMorgan et al...as they can, and do, print any chart pattern they please. I would think we'll find out pretty quick if what they're telegraphing to the market is the real deal or not, as their reaction to the next rally will tell us all we need to know.
(Click on image to enlarge)
(Click on image to enlarge)
I received an e-mail from reader Stephen Sadd yesterday...and these were his thoughts on the precious metal mining industry..."Why are there no voices coming from the mining sector on the gold and silver take-down? I find it highly remarkable there has been no strong cries of wrong doing from this entity. Are they just going to sit back like a bunch of zombies while their very own industry gets crushed, not to mention their shareholders. Just disgusting!"
I have other far less charitable words than this that I shall not utter here...but it's sufficient to say that they don't give a damn about you, the shareholder...and as a group they have already circled the wagons against their real owners...us. How did it come to this?
On that happy note, I'm done for the day...and the week.
See you on Tuesday.
http://harveyorgan.blogspot.com/2013/05/usa-exports-of-gold-in-janfeb-equal-to.html
Saturday, May 18, 2013
USA exports of gold in Jan/Feb equal to 130 tonnes/USA produces only 40 tonnes/ massive raid on gold and silver/GLD gold falls another 3.01 tonnes/Silver inventory at SLV drops 4.49 tonnes/
Gold closed down $22.20 to $1364.90 (comex closing time). Silver fell by 30 cents to $22.34 (comex closing time)
In the access market at 7 pm gold and silver are the following :
gold: $1360.20.
silver: $22.26
The bankers showed up early ready to attack gold and silver and their attack was fierce with copious non backed gold/silver paper. It seems that in the past 8 months,83% of Friday's resulted in raids. The demand for physical remains off the charts as premiums in India and China remain very high. Yet these criminals continue to drive the paper price lower much to the delight of citizens of Eastern persuasion.
At the Comex, the open interest in silver rose by 1745 contracts to 146,411 contracts despite silver's fall on Wednesday. The silver OI is holding firm at elevated levels . The open interest on the gold contract rose by 1445 contracts to 445,251 . With gold's big fall in price on Wednesday, one would have thought that the OI would have contracted big time. The gold deliveries for May rose considerably today to 9.365 tonnes and this is an off month for gold. In silver we continue to see the total number of ounces standing rise above the quantity that stood on first day notice. The number of silver ounces, standing for delivery in May fell a tiny 180,000 oz now stands at 17.180 million oz. ( On first day notice: 14.860 million oz.)
Again, at the Comex, gold is departing as investors are frightened to death of a confiscation similar to what happened at MFGlobal or Refco. Tonight, the Comex registered or dealer gold plummeted to 1.668 million oz or 51.88 tonnes. The total of all gold at the comex fell slightly but still well below the 8 million oz at 7.966 million oz or 247.77 tonnes of gold.
The GLD reported a huge loss in gold inventory of 5.71 tonnes which followed yesterday's loss of 4.52 tonnes of gold. The SLV inventory of silver also lowered by 1.545 million oz. The game will end when the last ounce of gold from the GLD leaves London's shores for Chinese waters.
In other physical news, we are witnessing continual increase in premiums for physical bars as the physical price deviates from the paper gold price.
Steve D'Angelo has reported that the exports of gold from the USA in January and February amounted to 130 tonnes of gold. The USA only produces 40 tonnes of gold. You should note that in January and February, the Comex and Mints recorded demand of 50.8 tonnes of gold. And we have not factored in any jewelery demand. The only answer as to why exports of gold are greater than mine supply is the use of official or Fort Knox gold. There is no other explanation!!
We will go over these and other stories but first.....................
Let us now head over to the comex and assess trading over there today:
The total gold comex open interest fell by only 256 contracts from 445,251 down to 444,995 with gold falling by $9.40 on Thursday. One would have thought that the OI would have contracted big time as positions would have liquidated at the lower gold price. The front non active delivery month of May saw its OI fall by 80 contracts up to 1067. However we had 88 delivery notice filed on Thursday. Thus we gained 8 contracts or 800 additional gold ounces will stand for delivery in May. The next active contract month is June and here the OI fell by 6899 contracts to 191,054 as most of these paper players rolled into August. June is the second biggest delivery month in gold's calender and first day notice is less than 2 weeks away. The estimated volume on Friday was good at 231,248 contracts. The confirmed volume on Thursday was also good at 248,573 contracts.
The total silver Comex OI surprisingly rise fell by only 140 contracts from 146,411 down to 146,271 with silver's fall in price of 3 cents on Thursday. The front active silver delivery month of May saw it's OI fall by 30 contracts down to 499. We had 27 delivery notices filed on Thursday so we lost 3 contracts or 15,000 oz will not stand for delivery in May. The next delivery month for silver is June and here the OI rose by 15 contracts to stand at 386. The next big active contract month is July and here the OI fell by only 265 contracts to rest tonight at 80,347. The estimated volume on Friday was good, coming in at 37,635 contracts. The confirmed volume on Thursday was good at 48,487.
In the access market at 7 pm gold and silver are the following :
gold: $1360.20.
silver: $22.26
The bankers showed up early ready to attack gold and silver and their attack was fierce with copious non backed gold/silver paper. It seems that in the past 8 months,83% of Friday's resulted in raids. The demand for physical remains off the charts as premiums in India and China remain very high. Yet these criminals continue to drive the paper price lower much to the delight of citizens of Eastern persuasion.
At the Comex, the open interest in silver rose by 1745 contracts to 146,411 contracts despite silver's fall on Wednesday. The silver OI is holding firm at elevated levels . The open interest on the gold contract rose by 1445 contracts to 445,251 . With gold's big fall in price on Wednesday, one would have thought that the OI would have contracted big time. The gold deliveries for May rose considerably today to 9.365 tonnes and this is an off month for gold. In silver we continue to see the total number of ounces standing rise above the quantity that stood on first day notice. The number of silver ounces, standing for delivery in May fell a tiny 180,000 oz now stands at 17.180 million oz. ( On first day notice: 14.860 million oz.)
Again, at the Comex, gold is departing as investors are frightened to death of a confiscation similar to what happened at MFGlobal or Refco. Tonight, the Comex registered or dealer gold plummeted to 1.668 million oz or 51.88 tonnes. The total of all gold at the comex fell slightly but still well below the 8 million oz at 7.966 million oz or 247.77 tonnes of gold.
The GLD reported a huge loss in gold inventory of 5.71 tonnes which followed yesterday's loss of 4.52 tonnes of gold. The SLV inventory of silver also lowered by 1.545 million oz. The game will end when the last ounce of gold from the GLD leaves London's shores for Chinese waters.
In other physical news, we are witnessing continual increase in premiums for physical bars as the physical price deviates from the paper gold price.
Steve D'Angelo has reported that the exports of gold from the USA in January and February amounted to 130 tonnes of gold. The USA only produces 40 tonnes of gold. You should note that in January and February, the Comex and Mints recorded demand of 50.8 tonnes of gold. And we have not factored in any jewelery demand. The only answer as to why exports of gold are greater than mine supply is the use of official or Fort Knox gold. There is no other explanation!!
We will go over these and other stories but first.....................
The total gold comex open interest fell by only 256 contracts from 445,251 down to 444,995 with gold falling by $9.40 on Thursday. One would have thought that the OI would have contracted big time as positions would have liquidated at the lower gold price. The front non active delivery month of May saw its OI fall by 80 contracts up to 1067. However we had 88 delivery notice filed on Thursday. Thus we gained 8 contracts or 800 additional gold ounces will stand for delivery in May. The next active contract month is June and here the OI fell by 6899 contracts to 191,054 as most of these paper players rolled into August. June is the second biggest delivery month in gold's calender and first day notice is less than 2 weeks away. The estimated volume on Friday was good at 231,248 contracts. The confirmed volume on Thursday was also good at 248,573 contracts.
The total silver Comex OI surprisingly rise fell by only 140 contracts from 146,411 down to 146,271 with silver's fall in price of 3 cents on Thursday. The front active silver delivery month of May saw it's OI fall by 30 contracts down to 499. We had 27 delivery notices filed on Thursday so we lost 3 contracts or 15,000 oz will not stand for delivery in May. The next delivery month for silver is June and here the OI rose by 15 contracts to stand at 386. The next big active contract month is July and here the OI fell by only 265 contracts to rest tonight at 80,347. The estimated volume on Friday was good, coming in at 37,635 contracts. The confirmed volume on Thursday was good at 48,487.
Comex gold/May contract month:
We had 1 customer deposit today:
i) Into Scotia vault: 65.425.336 oz
total customer deposit: 65,425.336 oz
We had 2 customer withdrawals today:
i Out of Scotia: 64,209.512 oz
ii) Out of Brinks; 450.01 oz
1961 contracts x 100 oz per contract or 196,100 oz (served) + 1058 notices or 105,800 oz (to be served upon) = 301,900 oz or 9.39 tonnes of gold.
This is extremely high for a non active month. We gained 800 additional gold ounces standing for the May comex gold contract today.
It is also interesting that the USA produces around 20 tonnes of gold per month
and thus the amount standing for gold this month represents almost 47% of that total production.
The big June delivery month will surely be exciting to watch judging by the huge demand for gold in May. We will watch what happens with JPMorgan with respect to its customer gold remains (now at 9.25 tonnes of gold) and the entire comex dealer gold close its nadir at 1.676 million oz.(52.13 tonnes)
May 17/2013
Ounces
| |
Withdrawals from Dealers Inventory in oz
|
nil
|
Withdrawals from Customer Inventory in oz
|
64,659.522 (Scotia,Brinks)
|
Deposits to the Dealer Inventory in oz
|
nil
|
Deposits to the Customer Inventory, in oz
| 65,425.336 (Scotia) |
No of oz served (contracts) today
|
9 (900 oz)
|
No of oz to be served (notices)
|
1058 (105,800)
|
Total monthly oz gold served (contracts) so far this month
|
1961 (196,100)
|
Total accumulative withdrawal of gold from the Dealers inventory this month
|
10,656.61
|
Total accumulative withdrawal of gold from the Customer inventory this month
| 602,966.0 oz |
We had good activity at the gold vaults.
The dealer had 0 deposits and 0 dealer withdrawals.
We had 1 customer deposit today:
i) Into Scotia vault: 65.425.336 oz
total customer deposit: 65,425.336 oz
We had 2 customer withdrawals today:
i Out of Scotia: 64,209.512 oz
ii) Out of Brinks; 450.01 oz
We had 0 adjustments
The JPMorgan customer vault remains at 297,426.75 oz today or 9.25 tonnes
as there were no transactions
The JPMorgan customer vault remains at 297,426.75 oz today or 9.25 tonnes
as there were no transactions
Tonight the dealer inventory dramatically remains tonight at a low of 1.668 million oz (51.88) tonnes of gold. The total of all gold rises slightly at the comex resting tonight at 7.967 million oz or 247.80 tonnes.
The CME reported that we had 9 notices filed today for 900 oz of gold.
To calculate the quantity of gold ounces that will stand, I take the OI standing for May (1067) and subtract out today's notices (9) which leaves us with 1058 notices or 105,800 oz left to be served upon our longs.
To calculate the quantity of gold ounces that will stand, I take the OI standing for May (1067) and subtract out today's notices (9) which leaves us with 1058 notices or 105,800 oz left to be served upon our longs.
Thus we have the following gold ounces standing for metal in May:
1961 contracts x 100 oz per contract or 196,100 oz (served) + 1058 notices or 105,800 oz (to be served upon) = 301,900 oz or 9.39 tonnes of gold.
This is extremely high for a non active month. We gained 800 additional gold ounces standing for the May comex gold contract today.
It is also interesting that the USA produces around 20 tonnes of gold per month
and thus the amount standing for gold this month represents almost 47% of that total production.
The big June delivery month will surely be exciting to watch judging by the huge demand for gold in May. We will watch what happens with JPMorgan with respect to its customer gold remains (now at 9.25 tonnes of gold) and the entire comex dealer gold close its nadir at 1.676 million oz.(52.13 tonnes)
end
Silver:
May 16.2013: May silver:
| Silver |
Ounces
|
| Withdrawals from Dealers Inventory | 549,652.39 (CNT) |
| Withdrawals from Customer Inventory | 307,320.634 oz (Delaware,Scotia) |
| Deposits to the Dealer Inventory | nil |
| Deposits to the Customer Inventory | 1019.90 (Delaware) |
| No of oz served (contracts) | 127 (635,000) |
| No of oz to be served (notices) | 502 (2,510,000 oz) |
| Total monthly oz silver served (contracts) | 2934 (14,670,000 oz) |
| Total accumulative withdrawal of silver from the Dealers inventory this month | 753,750.04 oz |
| Total accumulative withdrawal of silver from the Customer inventory this month | 2,839,070.2 oz |
Today, we had tiny activity inside the silver vaults.
we had 0 dealer deposits and 0 dealer withdrawals.
We had 0 customer deposits:
total customer deposit; nil oz
We had 2 customer withdrawals:
We had 0 customer deposits:
total customer deposit; nil oz
We had 2 customer withdrawals:
i) Out of Scotia: 636,447.70 oz
ii) Out of Delaware: 2015.40 oz
total customer withdrawals: 638,463.100 oz
ii) Out of Delaware: 2015.40 oz
total customer withdrawals: 638,463.100 oz
we had 0 adjustments today
Registered silver at : 43.902 million oz
total of all silver: 164.876 million oz.
The CME reported that we had 127 notices filed for 635,000 oz. To calculate the number of ounces that will stand in silver, I take the OI standing for May (529) and subtract out today's notices (27) which leaves us with 502 notices or 2,510,000 oz
Thus the total number of silver ounces standing in this active delivery month of May is as follows:
2934 contracts x 5000 oz per contract (served) = 14,670,000 + 502 contracts x 5000 oz = 2,510,000 oz ( to be served) = 17,186,000 oz.
we lost 180,000 oz of silver standing for May today. The total standing for silver is still superb for May.
GLD ETF - dropped from 1051 tons down to 1038 tons from 5/14 through 5/17
May 17.2013: (as of 6 pm est)
May 15.2013:
may 14.2013:
Tonnes1,038.41
Ounces33,386,040.80
Value US$45.683 billion
Tonnes1,041.42
Ounces33,482,727.36
Value US$46.226 billlion
May 15.2013:
Tonnes1,047.13
Ounces33,666,434.30
Value US$47.457 billion
may 14.2013:
Tonnes1,051.65
Ounces33,811,468.47
Value US$48.465 billion
At 3:30 pm Friday, they released the COT report.
Let us head over to the gold COT and see what we can glean from it;
(courtesy Goldseek.com)
Our large speculators:
Those large specs that have been long in silver covered a very tiny 144 contracts from their long side
Those large specs that have been short in silver added a large 2713 contracts to their short side
Our commercials':
Those commercials that have been long in silver added 1014 contracts to their long side
Those commercials that have been short in silver covered 224 contracts from their short side
Our small specs:
Those small specs that have been long in silver added 413 contracts to their long side
Those small specs that have been short in silver covered 1206 contracts from their short side.
Conclusions: if you believe these figures:
the commercials went net long again by 1238 contracts.
Thus Jan and February, on the demand side, had a total of 50.83 tonnes of gold delivered upon plus mint sales.
The mines produced 40 tonnes of gold.
And yet they exported 130 tonnes?
We thus have 130 tonnes of exported gold + 50.83 tonnes of gold demand from the Mints and Comex and we still have demand from jewellers. The supply: only 40 tonnes.
Thus, without jewellery demand, we must have a supply of 140 tonnes of gold coming from the official sector i.e. Fort Knox.
This is a crime scene!!
(courtesy Steve StAngelo)
Let us head over to the gold COT and see what we can glean from it;
(courtesy Goldseek.com)
| |||||||||||||||||||||||||||||||||||||||||||||||||||||||||||||||||||||||||||||||||||||||||||||||||||||||||||||||||||||||||||||||||||||||||||||||||||||||||||||||||||||||||||||||||||||||||||||||||||||||
Those large specs that have been long in silver covered a very tiny 144 contracts from their long side
Those large specs that have been short in silver added a large 2713 contracts to their short side
Our commercials':
Those commercials that have been long in silver added 1014 contracts to their long side
Those commercials that have been short in silver covered 224 contracts from their short side
Our small specs:
Those small specs that have been long in silver added 413 contracts to their long side
Those small specs that have been short in silver covered 1206 contracts from their short side.
Conclusions: if you believe these figures:
the commercials went net long again by 1238 contracts.
| This is an very important commentary from Steve St Angelo, of the SRSrocco report. During the first two months of January and February 2013, the uSA exported 130 metric tonnes of gold from USA soil. The USA produces 240 tonnes of gold per year and thus over these two months in question, 40 tonnes was produced by all USA mines. I went back to my last commentary in February where I reported that 40.68 tonnes of gold stood for the February delivery month. January saw 3.01 tonnes of gold standing for delivery. In January the USA mint produced 150,000 oz of gold or 4.66 tonnes. In February, 80,000 oz were minted or 2.48 tonnes. Thus in summary; January gold standing for delivery: Feb gold standing for delivery: 3.01 tonnes 40.68 tonnes |
January Mint sales: Feb Mint sales:
4.66 tones 2.48 tonnes
Totals for January totals for February totals for both months:
7.67 tonnes 43.16 tonnes 50.83 tonnes
The mines produced 40 tonnes of gold.
And yet they exported 130 tonnes?
We thus have 130 tonnes of exported gold + 50.83 tonnes of gold demand from the Mints and Comex and we still have demand from jewellers. The supply: only 40 tonnes.
Thus, without jewellery demand, we must have a supply of 140 tonnes of gold coming from the official sector i.e. Fort Knox.
This is a crime scene!!
(courtesy Steve StAngelo)
U.S. Gold Exports: Almost 130 Metric Tonnes During Jan-Feb, 2013
-- Posted Friday, 17 May 2013 | Share this article | 0 Comments and 0 Reactions
by Steve St.Angelo, SRSrocco Report,
There seems to be a great deal of the yellow metal heading out of the United States andinto certain foreign countries lately. According to the USGS, theUnited States exported 129 metric tonnes of gold Jan-Feb, 2013. At this rate, total U.S. gold exports could reach 700-800 metric tonnes this year. With the recent take-down in the price of gold in April & May, I wouldimagine the United States is more than likely going to reach that figure.
If we look atthe chart below we can see just who received all this gold:
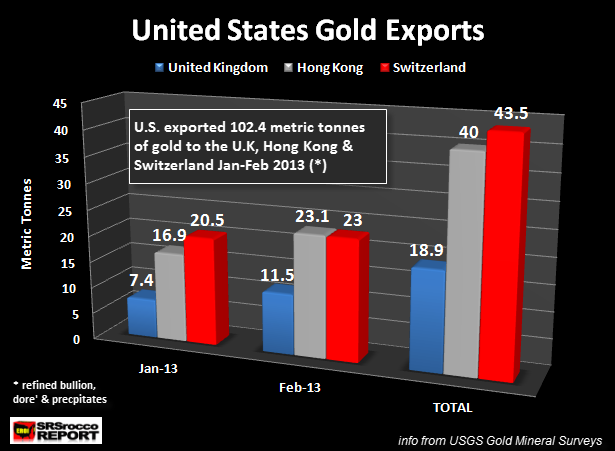
The figures in the chart represent gold in refined bullion, Dore' & precipitates. The U.K. received 7.4 metric tonnes in Jan and 11.5 more in Feb for a total of 18.9 metric tonnes. Hong Kong came in second by importing a total of 40 metric tonnes (Jan-Feb) from the United States, while Switzerland received 43.5 metric tonnes.
In total, the United States exported 129 metric tonnes of gold in the first two months of 2013. The U.K, Hong Kong and Switzerland accounted for 102.4 metric tonnes or nearly 80% of all U.S. Gold exports during these two months.
Furthermore,the U.S. only imported 50 metric tonnes of gold during this time period,while domestic gold production supplied an additional 35 more. With a total of 85 metric tonnes of gold imports and domestic mine supply, the United States suffered a net deficit of 44 metric tonnes in the first two months of the year.
If the rumors are true that supplies of gold are in short supply, I would imagine the UnitedStates will be exported a record amount of gold during the remainder of 2013... that is, if there is the available gold to export.
|


No comments:
Post a Comment